Comparing Two Date Ranges Without Fooling Yourself
Google Search Console date comparisons mislead easily. Learn how to match ranges, avoid the 16-month data wall, and read swings correctly.

Published August 2026. SEO team at PalV’s DM.
Comparing two date ranges in Google Search Console only tells you something true if both periods are the same length, the same mix of weekdays, and free of any known Google update or site change in between. Line up 28 days against 30, or a holiday week against a normal one, and the “clicks dropped 12%” headline you report to a client can be an artifact of the calendar, not a ranking problem.
Why does a GSC date comparison go wrong so easily?
The Performance report’s built-in “Compare” feature will let you compare almost anything to almost anything else, and it will not warn you when the comparison is unfair. Google’s own Search Console documentation describes the tool as a way to spot trends, not a statistically controlled test. The burden of setting up a fair comparison sits entirely with the person pulling the report.
Three things break comparisons most often in practice: mismatched day counts, a data window that crosses a known volatility event (an algorithm update, a manual action, a site migration), and treating a partial current period as if it were complete. GSC data usually lags 2-3 days, so the last few days of “today” in the tool are often incomplete rows, not a real decline.
How do you match date ranges correctly?
Match range length first, always. If you’re comparing the last 28 days to the prior 28 days, both windows need to be exactly 28 days, not 28 vs. 30, and not a range that includes today (which is still filling in).
- Use equal-length windows. 7 vs 7, 28 vs 28, or 90 vs 90 days, never mix lengths.
- Prefer week-over-week or 28-day cycles over calendar months. Months have 28-31 days and different weekday mixes, which skews B2B and weekday-heavy traffic patterns.
- Exclude the most recent 2-3 days from “current period” comparisons since that data is still being finalised.
- Note any known event in the window, a core update, a redesign, a robots.txt change, before drawing conclusions from the numbers.
What is the 16-month data limit and why does it matter here?
Search Console retains roughly 16 months of Performance data. That’s enough for a clean year-over-year comparison of a single month, but it rules out multi-year trend analysis inside the native tool. If you need to compare August 2026 to August 2023, GSC’s UI simply doesn’t have the data anymore, you’d need to have exported it earlier via the API or Looker Studio.
This also means “compare to last year” only works cleanly for roughly the trailing 16 months. Plan exports if year-over-year reporting matters to your business, rather than assuming the data will still be there when you need it.
How should you read a swing once you’ve confirmed the comparison is fair?
Once the date ranges are genuinely comparable, separate clicks, impressions, CTR, and average position, a swing in one doesn’t always mean the others moved the same way. Impressions can rise while clicks fall if a page started ranking for more low-intent queries. Average position can improve while clicks drop if the page moved from position 4 to position 3 on a query nobody searches for anymore.
| Signal | What moved | Likely explanation |
|---|---|---|
| Clicks down, impressions flat | CTR | SERP feature (AI Overview, featured snippet) is absorbing clicks above you |
| Impressions up, clicks flat | Reach without CTR | New queries ranking, but title/snippet isn’t earning the click |
| Both down, same position | Demand | Search volume for the topic itself has dropped, check Google Trends |
| Position worse, clicks flat | SERP layout | You dropped a rank but a SERP feature above you shrank too, netting out |
Does India’s search seasonality make this worse?
Yes, more than most teams expect. Festival periods around Diwali, Holi, and the wedding season shift both search demand and CTR for e-commerce and local-service queries in ways that have nothing to do with your SEO work. A D2C brand comparing October to September without accounting for Diwali shopping spikes will read a completely normal seasonal pattern as a ranking win or loss. The same applies in reverse in January and February, when demand for many categories cools after year-end sales.
If your business has a clear seasonal pattern, the fairest comparison is often the same period a year earlier rather than the prior 28 days. That trades recency for a like-for-like demand baseline, which matters more than proximity in seasonal categories.
What does a corrected comparison look like in practice?
Take a home services site that reports “organic clicks down 18% this month” after simply comparing the current calendar month to the previous one. Pulling the raw dates shows the prior month had 31 days and included five Sundays, while the current month has 28 days and only four, a full extra low-traffic weekend day baked into the “better” period before any real change is considered. Re-running the comparison as a strict 28-day window against the prior 28-day window, both ending three days before today to avoid partial data, shows clicks down only 4%, which lines up with a manual action review showing nothing unusual and a modest, expected dip in search volume for the site’s main category that month. The original 18% figure wasn’t wrong arithmetic, it was an unfair comparison dressed up as a finding, and it would have triggered an unnecessary technical audit if it had gone to the client unchecked.
What mistakes come up most often in practice?
A few patterns repeat across almost every account we’ve reviewed, regardless of industry:
- Comparing “last 3 months” to “previous 3 months” without checking whether either window includes a partial month, which quietly shortens one side.
- Reading device-level swings as site-wide, a mobile CTR drop from a new SERP layout can look like an overall decline if you don’t split by device first.
- Ignoring branded vs non-branded split. A branded query spike from a PR mention or ad campaign can mask a real decline in non-branded rankings when both are lumped into one number.
- Treating regex or URL filter changes as like-for-like. If a filter was added or removed between the two periods being compared, the underlying page set isn’t the same anymore.
What’s a workable weekly process for date comparisons?
- Pick a fixed comparison cadence, weekly (7 vs 7) for fast-moving sites, 28-day for most SMB sites.
- Exclude the trailing 3 days from “this period” before comparing.
- Log known events (updates, migrations, content pushes) in a simple sheet so a future swing has an explanation on file.
- Cross-check with GA4 if the swing is larger than about 15%, since GSC and GA4 use different attribution logic and rarely match exactly, see our note on why the two never match precisely.
- Segment before concluding, split by page type or query intent before deciding the whole site moved.
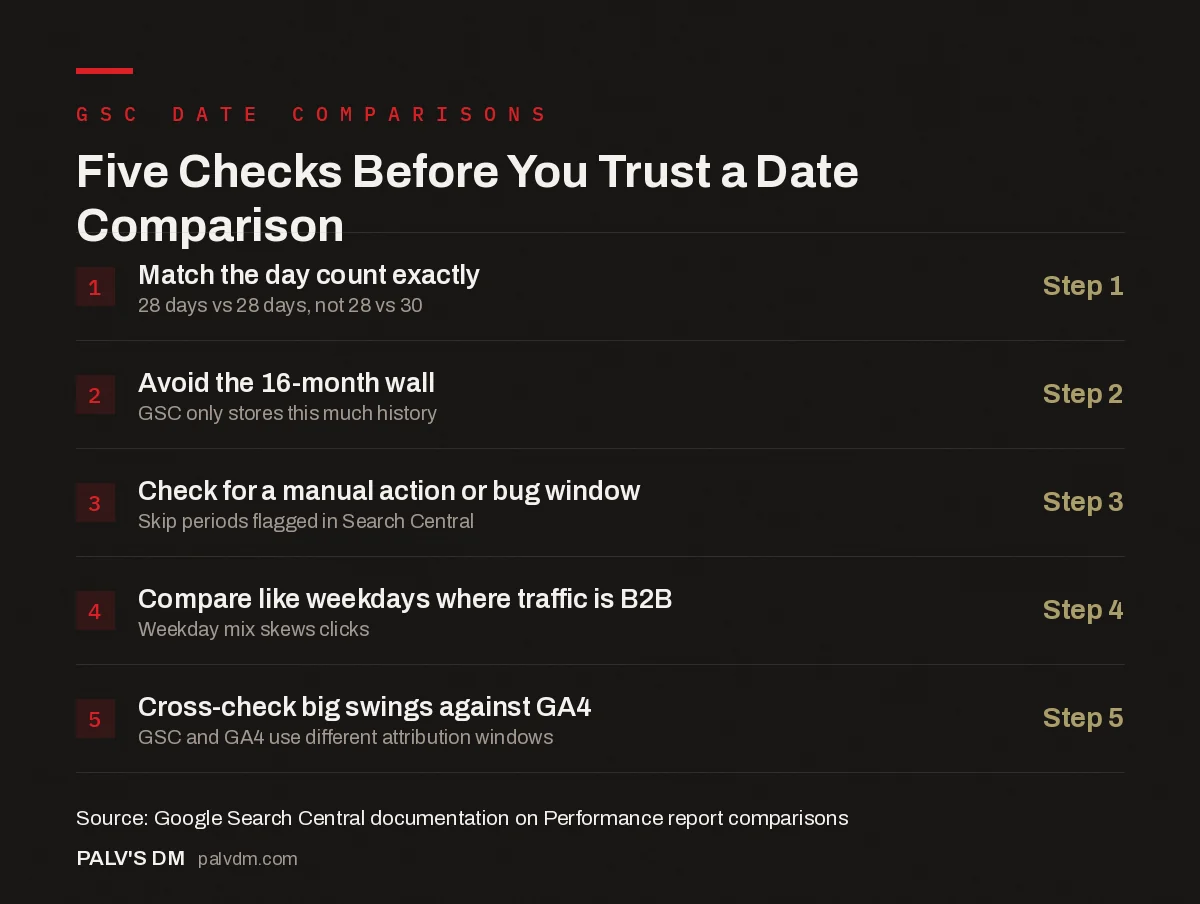
Five Checks Before You Trust a Date Comparison
- Match the day count exactly. Step 1. 28 days vs 28 days, not 28 vs 30.
- Avoid the 16-month wall. Step 2. GSC only stores this much history.
- Check for a manual action or bug window. Step 3. Skip periods flagged in Search Central.
- Compare like weekdays where traffic is B2B. Step 4. Weekday mix skews clicks.
- Cross-check big swings against GA4. Step 5. GSC and GA4 use different attribution windows.
Should you compare at the page level, the query level, or both?
Whole-site comparisons are the easiest to pull and the easiest to misread, since a big move in one high-traffic page or query can dominate the average and hide what’s happening everywhere else. A site-wide “clicks up 6%” can conceal one page up 40% and a dozen others quietly declining. Once a whole-site comparison flags a change worth investigating, the next step should always be breaking it down, by page to find which URLs actually moved, and by query to see whether the movement is concentrated in a handful of terms or spread evenly. A change concentrated in one page usually has a specific, findable cause (a content update, a lost backlink, a technical issue); a change spread evenly across dozens of pages more often points to something external, like an algorithm update or a shift in overall search demand for the category.
If your team is reporting month-over-month numbers to stakeholders without checking any of this, the story you’re telling could easily be wrong in either direction, hiding a real problem or manufacturing a fake one. This is exactly the kind of reporting hygiene we build into ongoing SEO Growth engagements, so date comparisons hold up when a client asks “why did this change?”
For the broader set of reports worth checking regularly, see our Google Search Console guide, and if content ideas are what you’re really after from GSC data, we’ve covered mining GSC for content ideas separately.
FAQ
Can I trust the “Compare” feature’s percentage change number on its own?
Not without checking date range length and weekday mix first. The percentage is arithmetically correct but can be comparing unequal periods. Always confirm both ranges have the same number of days and, ideally, the same weekday distribution before treating the percentage as meaningful.
How far back does Google Search Console keep data?
Around 16 months on a rolling basis. This supports year-over-year comparisons for the trailing period but not longer historical trend work inside the native UI. Export data via the API or Looker Studio if you need to preserve it beyond that window.
Why do GSC and GA4 show different numbers for the same period?
They measure different things using different logic, GSC counts clicks on search results, GA4 counts sessions after page load, and bot filtering, consent settings, and attribution windows differ between the two. A gap of 10-20% between them is common and not automatically a tracking error.
Should I exclude today’s data from a date comparison?
Yes. Search Console data typically lags 2-3 days behind real time, so the most recent days in any “current period” range are often incomplete. Comparing a partial day against a complete one in the prior period will always look like a decline.
Is week-over-week or month-over-month the better default?
Week-over-week (7 vs 7 days) suits sites with fast content cycles or high query volume. 28-day windows suit most small and mid-sized business sites since they smooth out weekday noise while staying inside a reasonable reporting cadence.
What’s the simplest way to catch a mismatched date range before it goes into a report?
Write both date ranges out explicitly at the top of the report, with the actual day count next to each, for example “Current: Jul 21 – Aug 17 (28 days)” and “Prior: Jun 23 – Jul 20 (28 days)”, rather than trusting labels like “this month vs last month.” Spelling out the day count forces a quick manual check every time, and it’s the single fastest way to catch the mismatch before a client sees it.