
Case studies
Success stories, with the numbers behind them.
We don’t report vanity metrics. Below are growth journeys across healthcare, real estate, education, beauty, e-commerce and new builds — what the problem was, what we changed, and the figures that moved as a result.
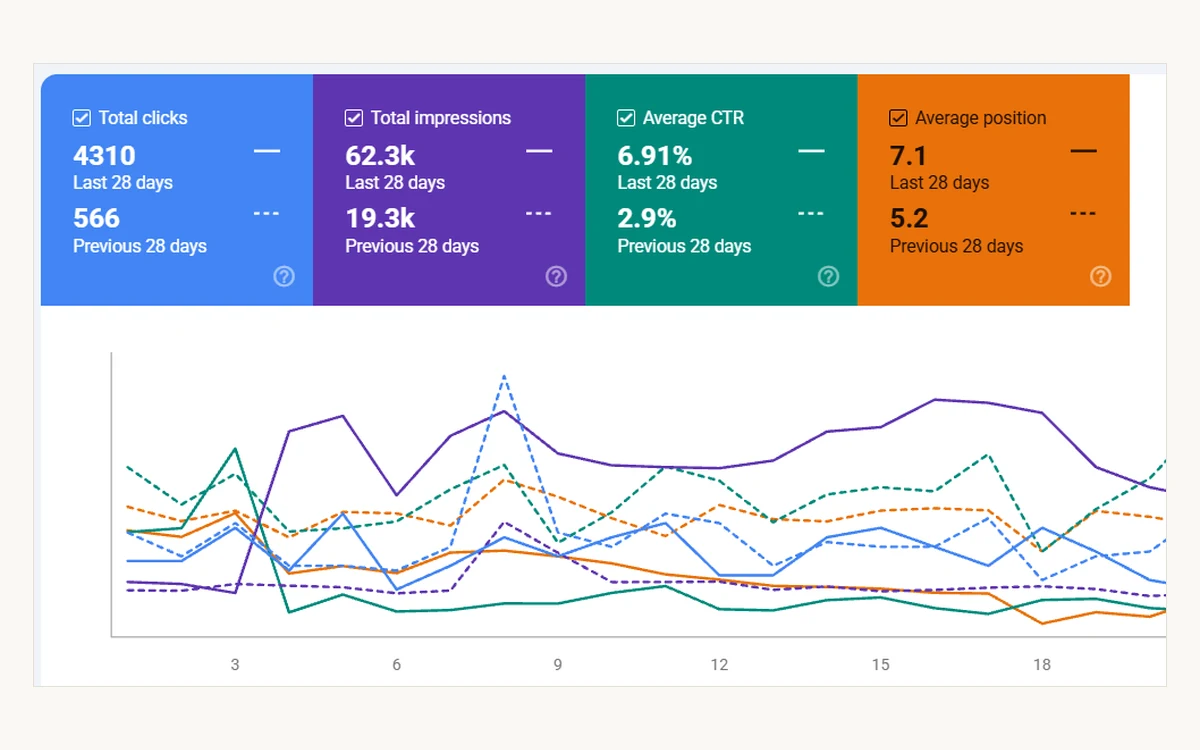
Existing site
Clicks up 7.6× in a month, with click-through more than doubled
The challenge. Impressions were there and clicks were not. The site was being shown and scrolled past, which is a different problem from not ranking and does not respond to the same fix.
- 566 → 4,310 clicks in 28 days
- CTR 2.9% → 6.91% while impressions tripled
- 19.3K → 62.3K impressions
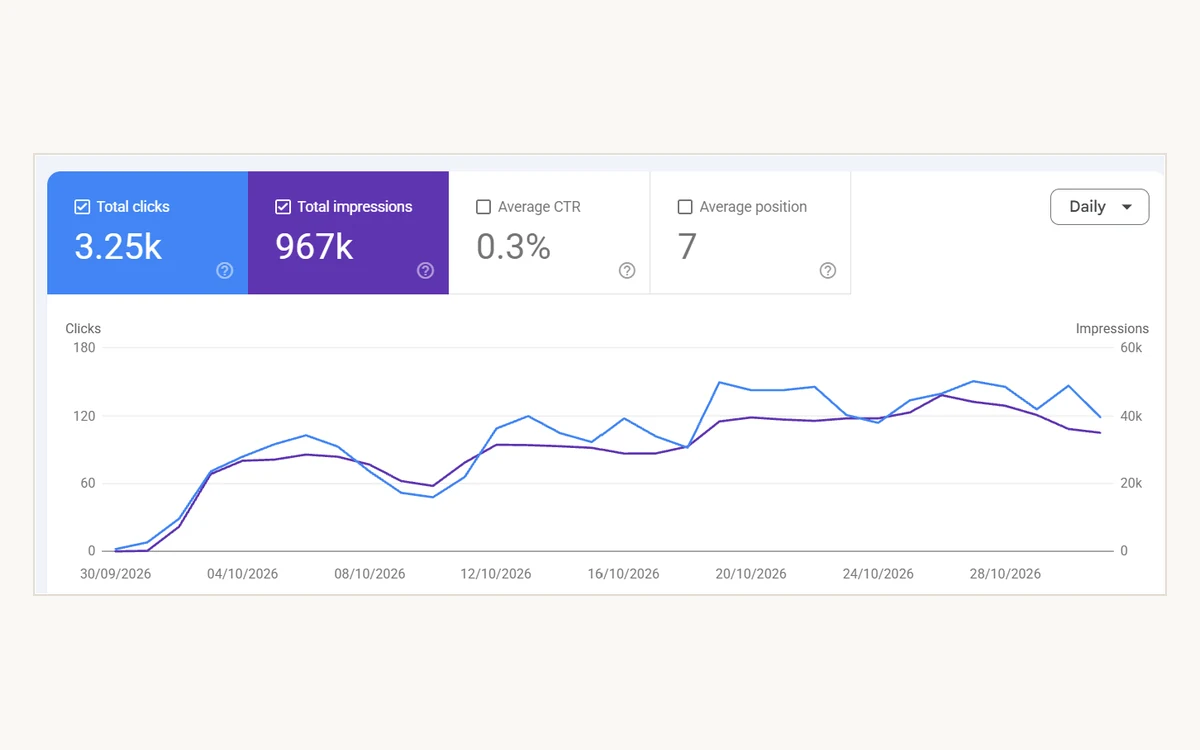
New build
A site that did not exist, to 967K impressions in month one
The challenge. A domain with no history — nothing indexed, no links, no record with Google. Every impression had to be earned from the first crawl, with no existing authority to borrow against.
- 967K impressions and 3,245 clicks in 31 days
- Average position 7 across the whole footprint
- 47 contact actions, including 10 enquiry forms
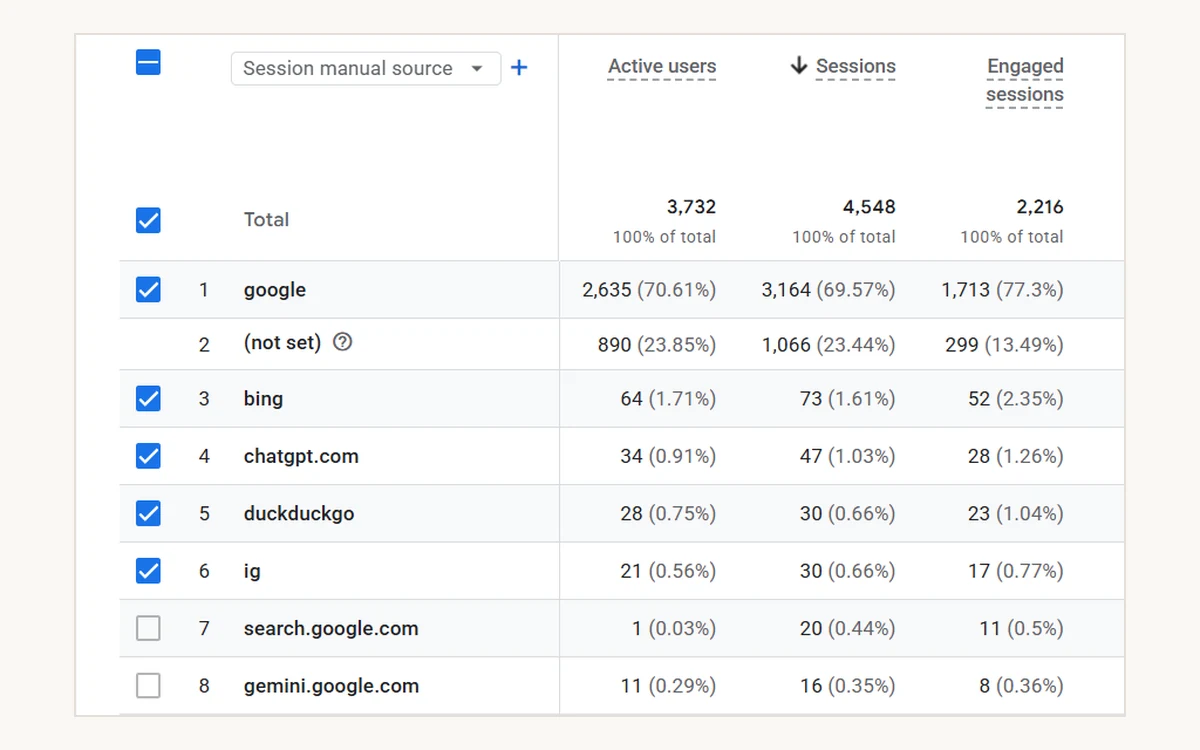
New build · GEO
Cited by ChatGPT in the first month, and read for longer than Google sent
The challenge. A new site is invisible to answer engines by default: nothing published, nothing quotable, and no reason for a model to reach for it when someone asks the question it answers.
- ChatGPT and Gemini sent 63 sessions in month one
- AI referrals engaged at 59.6%, against 54.1% from Google
- 3,368 engaged users across eight countries, one paid session
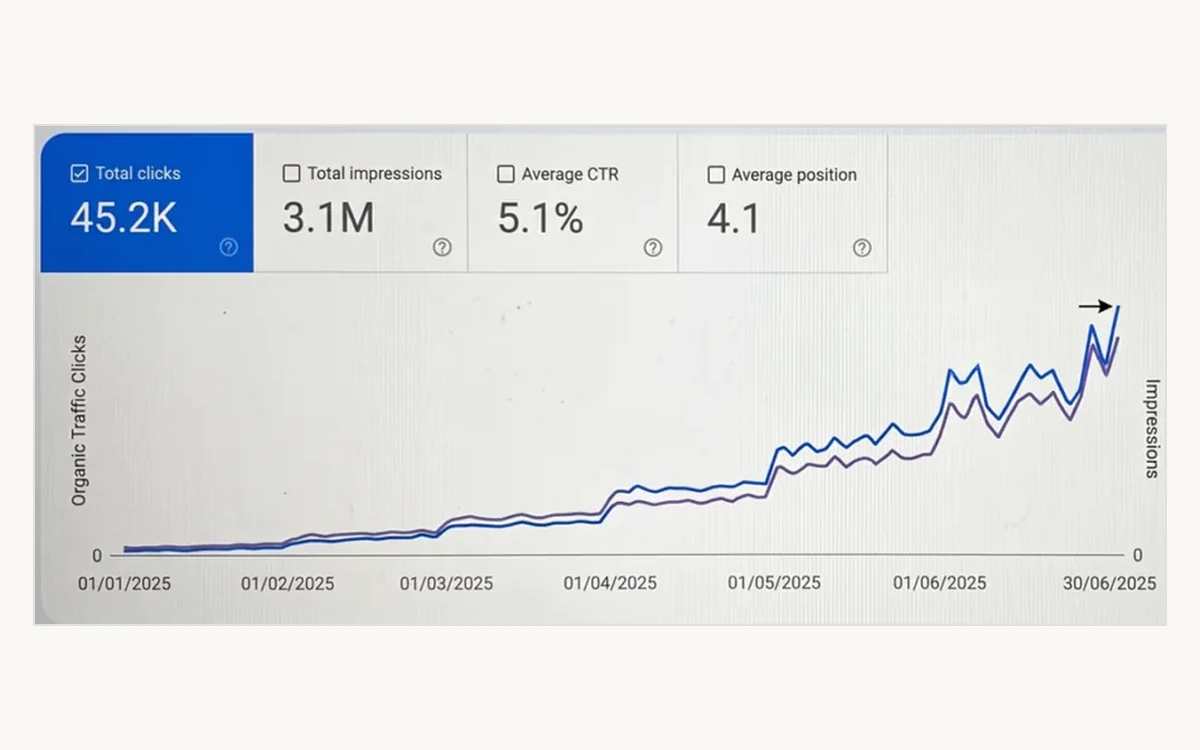
E-commerce
Sixty-two revenue pages Google could not reach
The challenge. Faceted navigation generated thousands of parameter URLs that consumed the crawl budget before Googlebot ever arrived at the product catalogue.
What moved it. Parameters blocked at source, a clean paginated path opened to the catalogue, and the hero imagery that was wrecking mobile load times compressed.
- 45.2K clicks and 3.1M impressions
- 5.1% click-through at average position 4.1
- Indexation from 148 to 210 pages (reported by the client)
EdTech
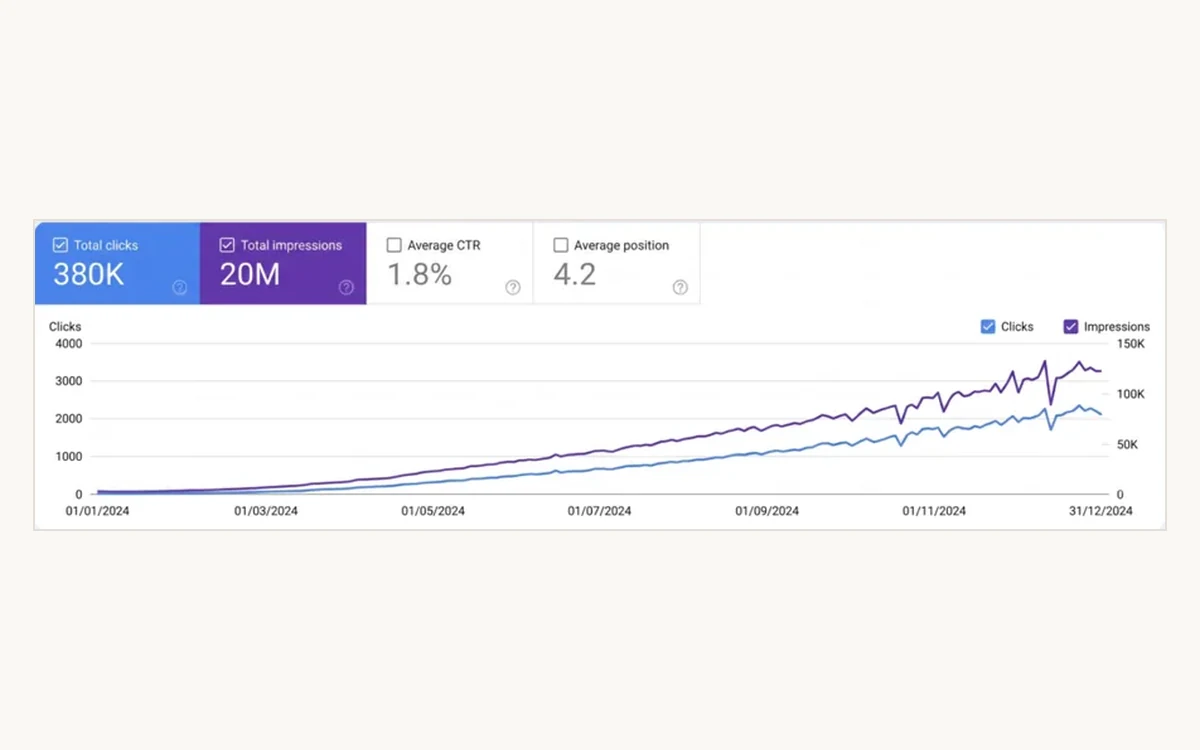
A course catalogue Google was not indexing
The challenge. A fast-growing catalogue that search engines never fully crawled, so every new launch landed to silence rather than to traffic.
What moved it. Site architecture restructured around topic and level, technical debt cleared, and content built against the questions students actually type.
- 380K clicks and 20M impressions
- 1.8% click-through at average position 4.2
- +32% course enrolments (reported by the client)
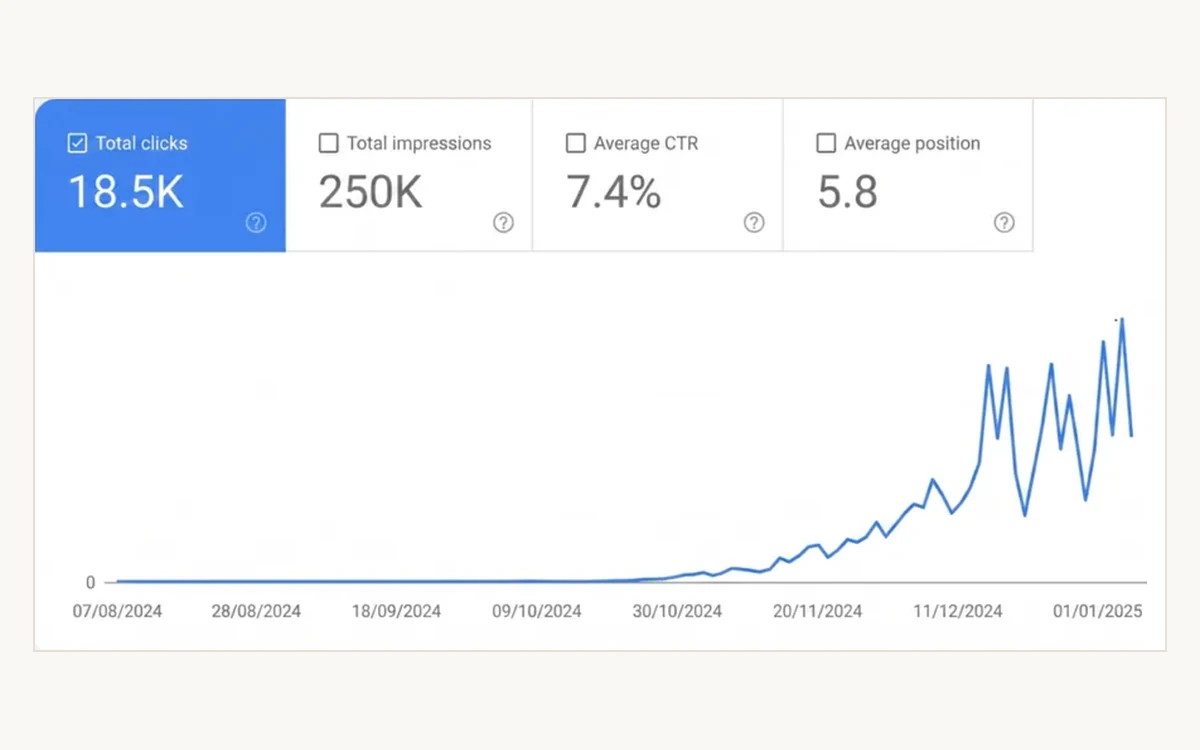
Real Estate · GEO
Cited by ChatGPT in a category that had never heard of them
The challenge. Pages written in promotional language left nothing quotable, so the brand was absent when buyers asked AI models who the best developers were.
What moved it. Comparison and pricing pages rebuilt around direct factual answers, Organization schema added, and methodology pages published as something an engine can cite.
- 18.5K clicks at 7.4% click-through, position 5.8
- 14 of 20 tracked prompts won
- 3 of 4 answer engines citing the brand
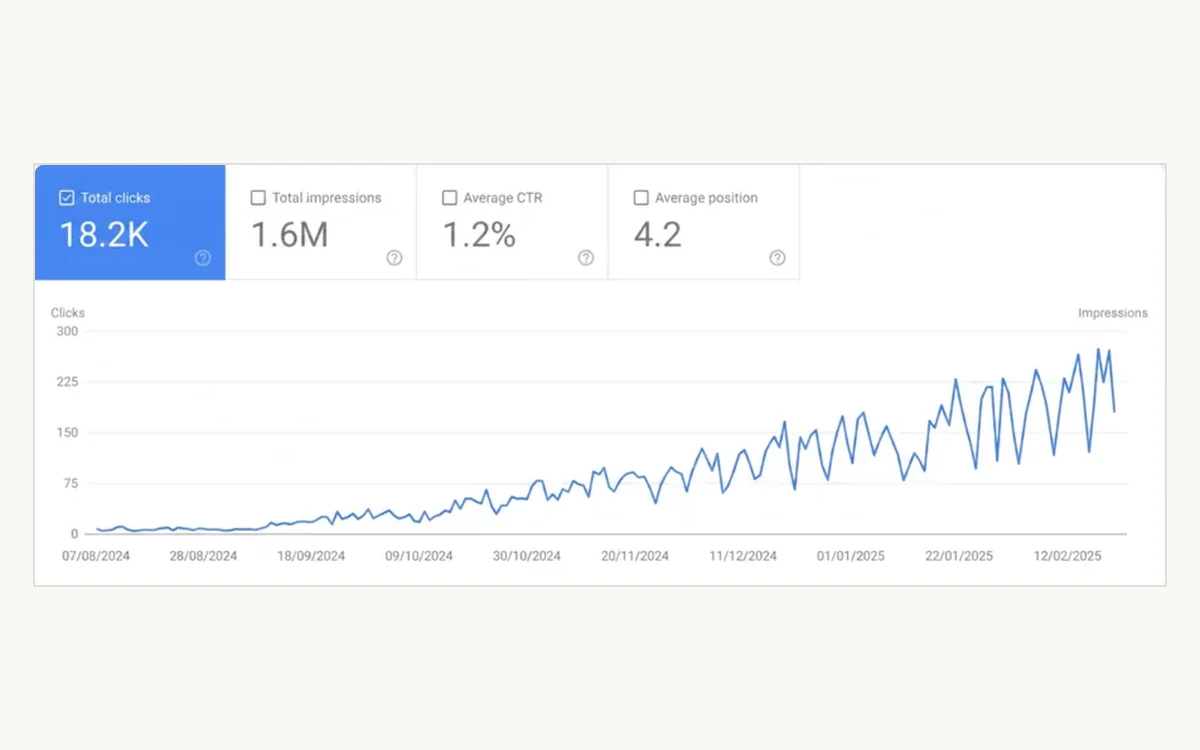
Healthcare
4X organic clicks and 120% more patient calls
The challenge. Low local visibility, with the Google Business Profile treated as a set-and-forget directory while competitors took the daily appointments.
What moved it. Rebuilt the local foundation: site aligned to the profile, Medical and FAQ schema so engines could read the services, content shifted to high-intent local queries.
- 18.2K clicks and 1.6M impressions
- 1.2% click-through at average position 4.2
- +120% patient enquiries (reported by the client)
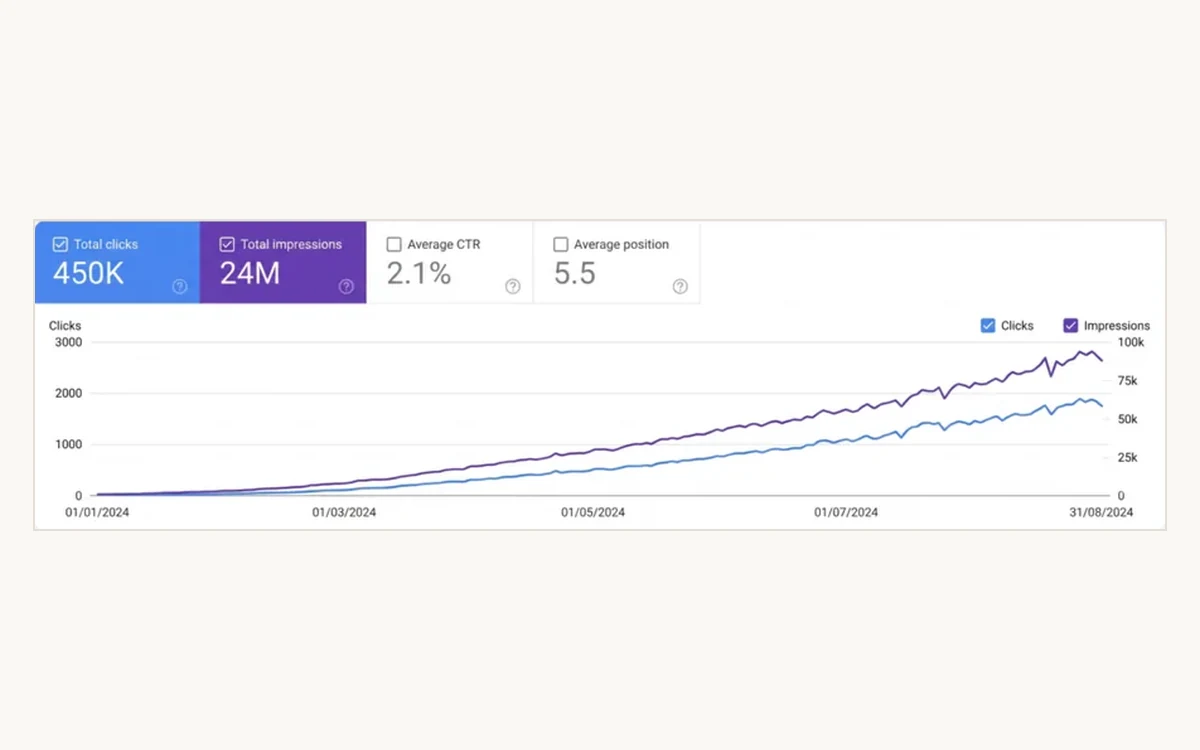
Real Estate
3X organic growth with 80% of target keywords in the top five
The challenge. High bounce rates and weak rankings against aggregator portals, producing low-quality leads on high-ticket properties.
What moved it. Technical overhaul, location-specific landing pages built to match how buyers actually search, and internal linking that pushed authority to the money pages.
- 450K clicks and 24M impressions
- 2.1% click-through at average position 5.5
- +40% lead-to-site-visit conversion (reported by the client)
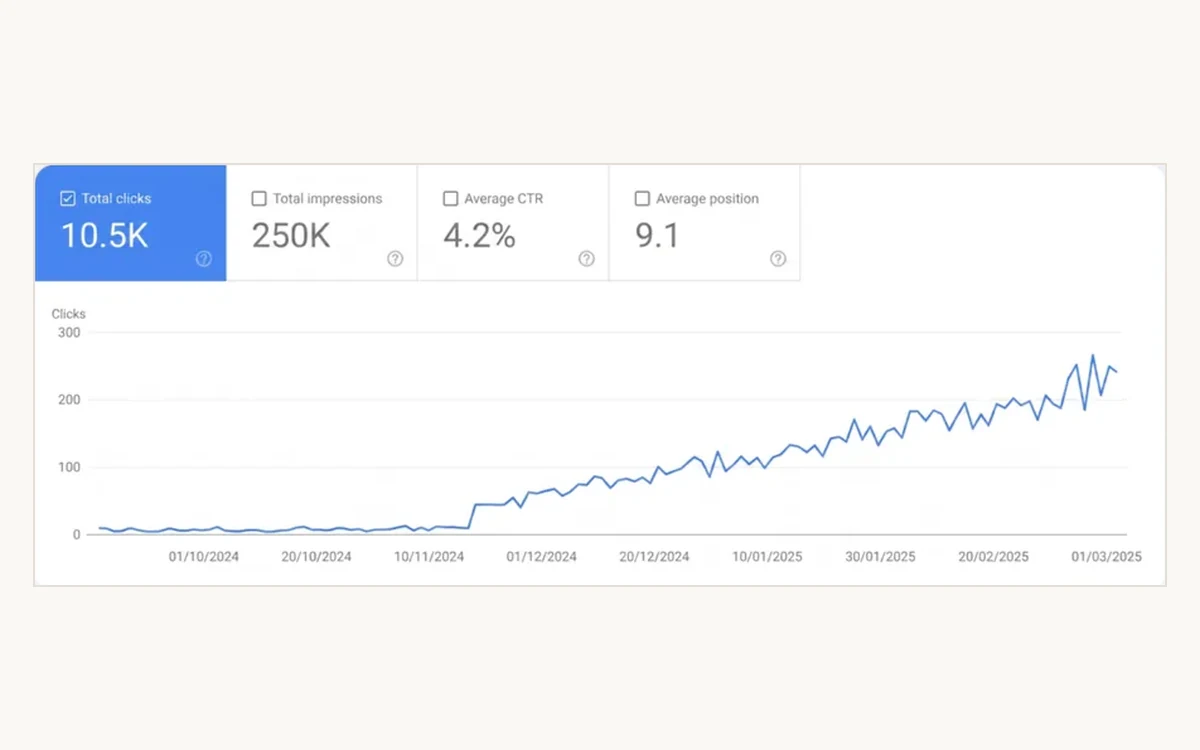
Beauty & Local
A salon’s own site, pulled up past the directories
The challenge. Searches for the treatments this salon actually performed were landing on aggregator listings and nearby competitors rather than on the salon’s own pages.
What moved it. Localised service pages written per treatment, a structure that matched how people search in their own area, and a review process the team could keep running without us.
- 10.5K clicks and 250K impressions
- 4.2% click-through at average position 9.1
- 2.5X organic traffic across the window
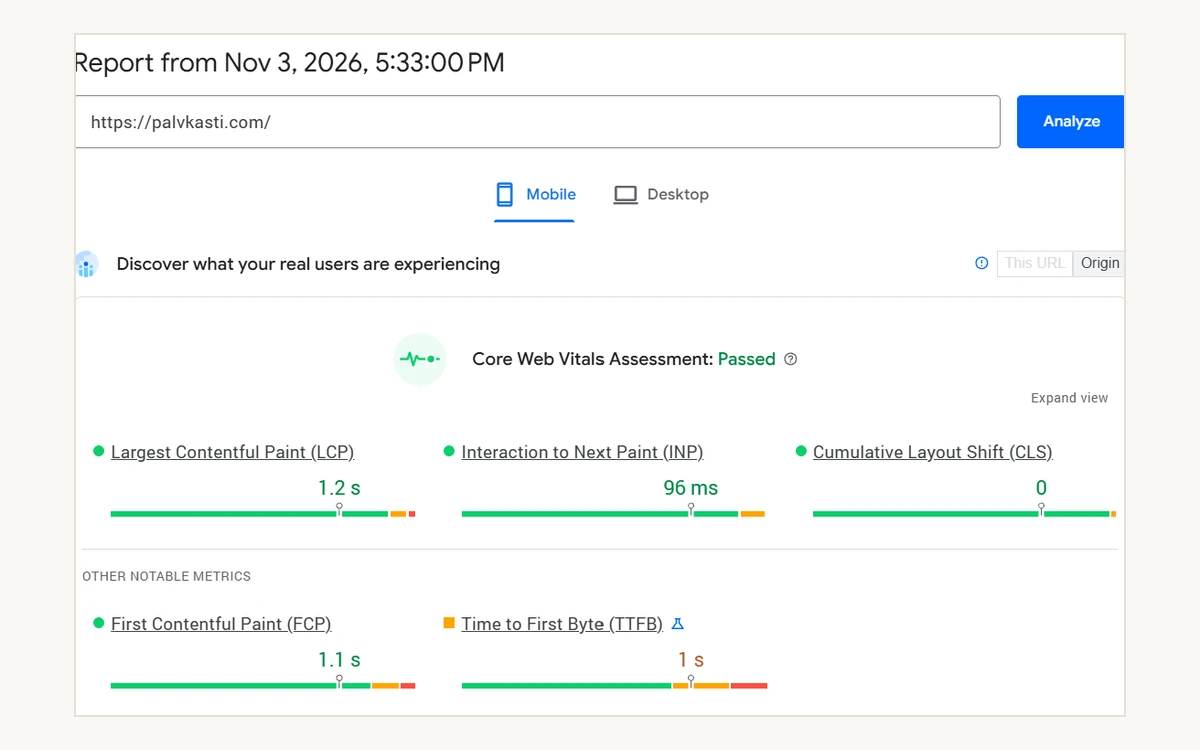
Core Web Vitals
Passing Core Web Vitals on real users, not lab numbers
What it shows. Field data from actual visitors. Google only reports this once a site carries enough real traffic to measure, so it is a stronger signal than any lab score.
- LCP 1.2s, INP 96ms, CLS 0
- Core Web Vitals assessment: passed
- First Contentful Paint 1.1s on mobile
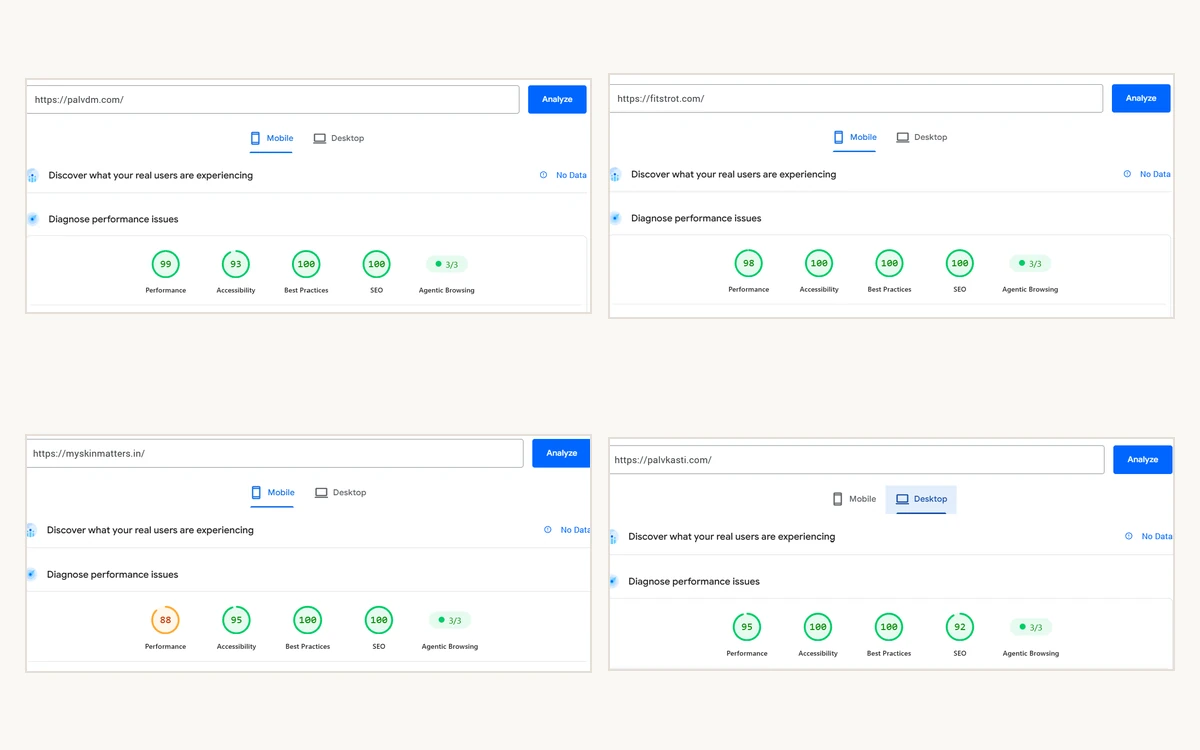
Build performance
Four live builds, 88 to 99 on mobile performance
What it shows. PageSpeed Insights across four sites we built, all run the same afternoon. These are lab scores: they show the builds are fast, not that a slow site was rescued.
- Performance 88–99, Best Practices 100 on all four
- SEO 92–100, Accessibility 93–100
- palvdm.com 99 · fitstrot.com 98 · palvkasti.com 95 · myskinmatters.in 88
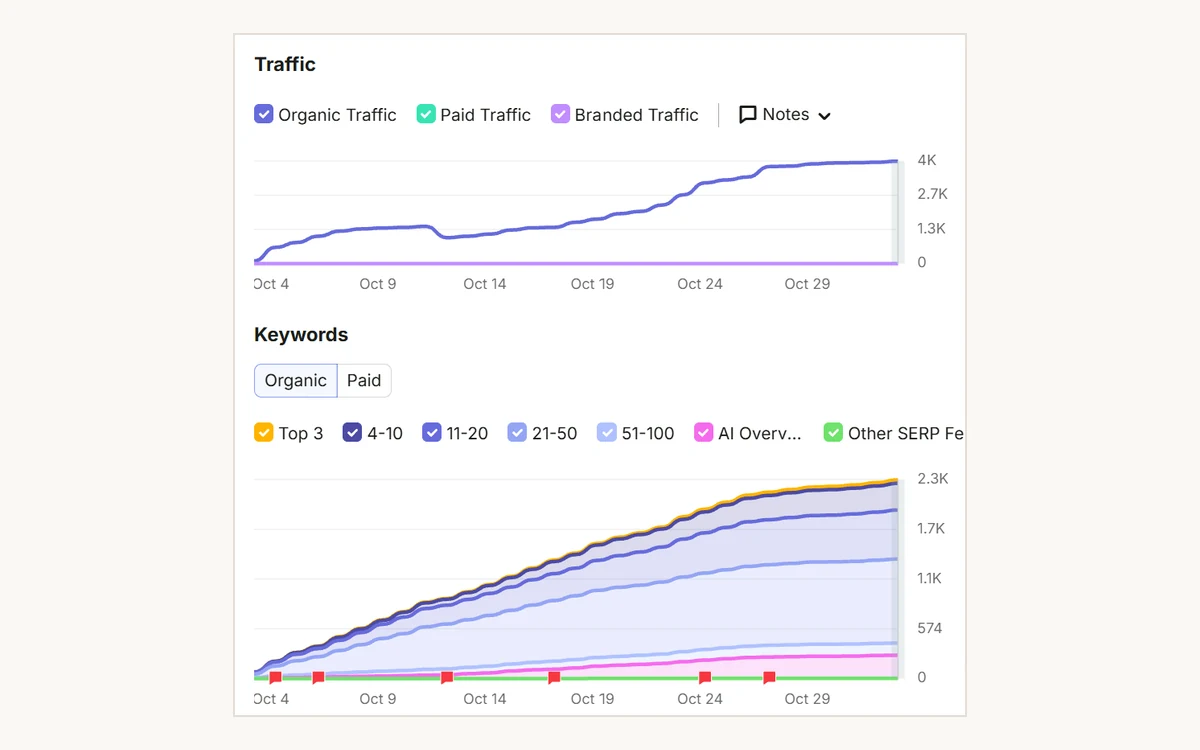
Keyword footprint
Zero to 2.3K ranking keywords in under a month
What it shows. A rank tracker’s view of the same launch window: keywords entering the index, and the estimated traffic that follows them.
- 0 → 2.3K ranking keywords in 26 days
- Positions spread from top three down to 51–100
- Appearing in AI Overviews inside the first month
Keyword footprint
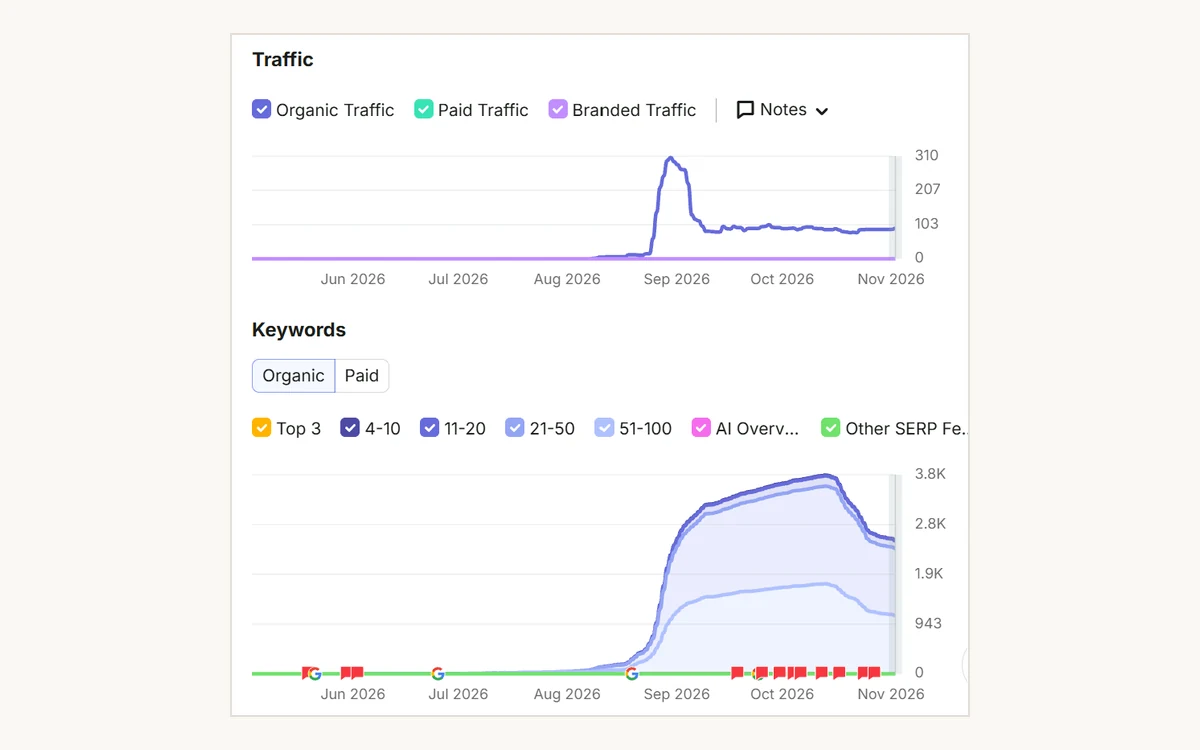
3.8K keywords built from nothing, then a settle
What it shows. Six months of the same measure. The footprint built fast, peaked at 3.8K keywords in late October, and has since eased back — which is what the curve shows and what the card says.
- 0 → 3.8K ranking keywords since August
- Estimated traffic steady near 100 a day after an early spike
- Footprint now easing from 3.8K toward 2.8K
GA4 overview
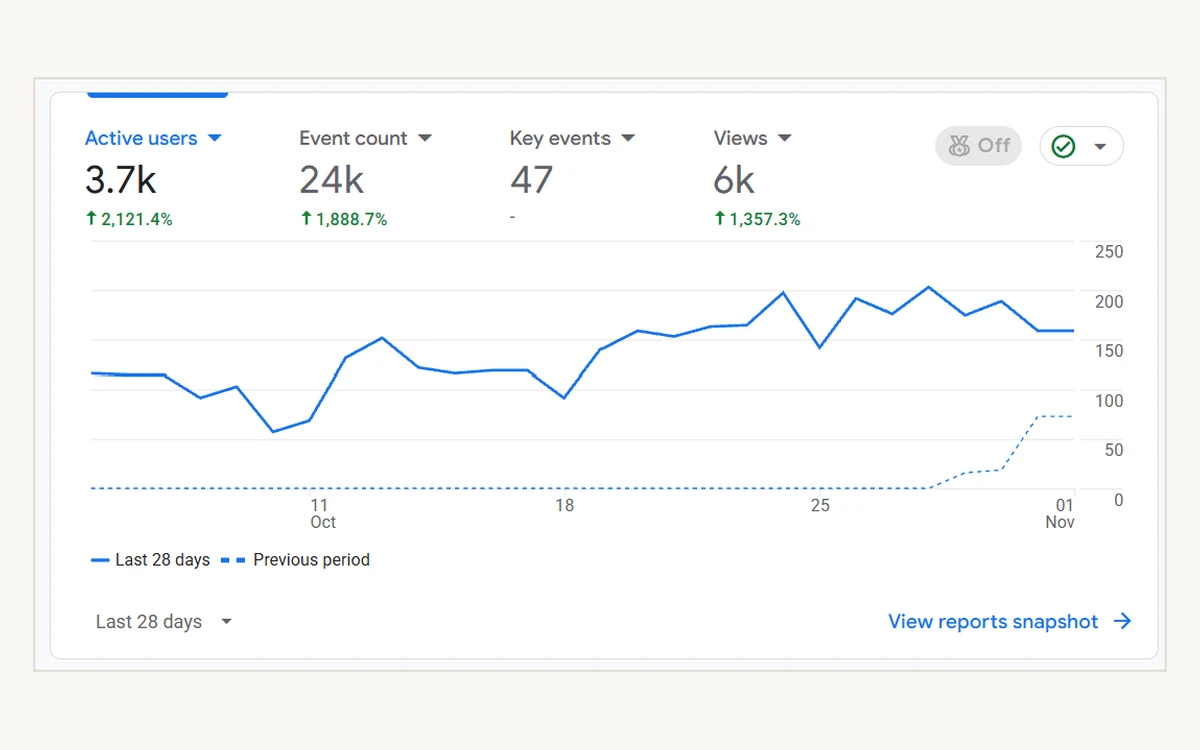
3.7K users and 24K events in the launch month
What it shows. The whole property for month one. The growth percentages on this card are measured against a period when the site did not exist, so the absolute figures are the honest read.
- 3.7K active users and 6K page views
- 24K events recorded
- 47 key events — the contact actions
GA4 channels
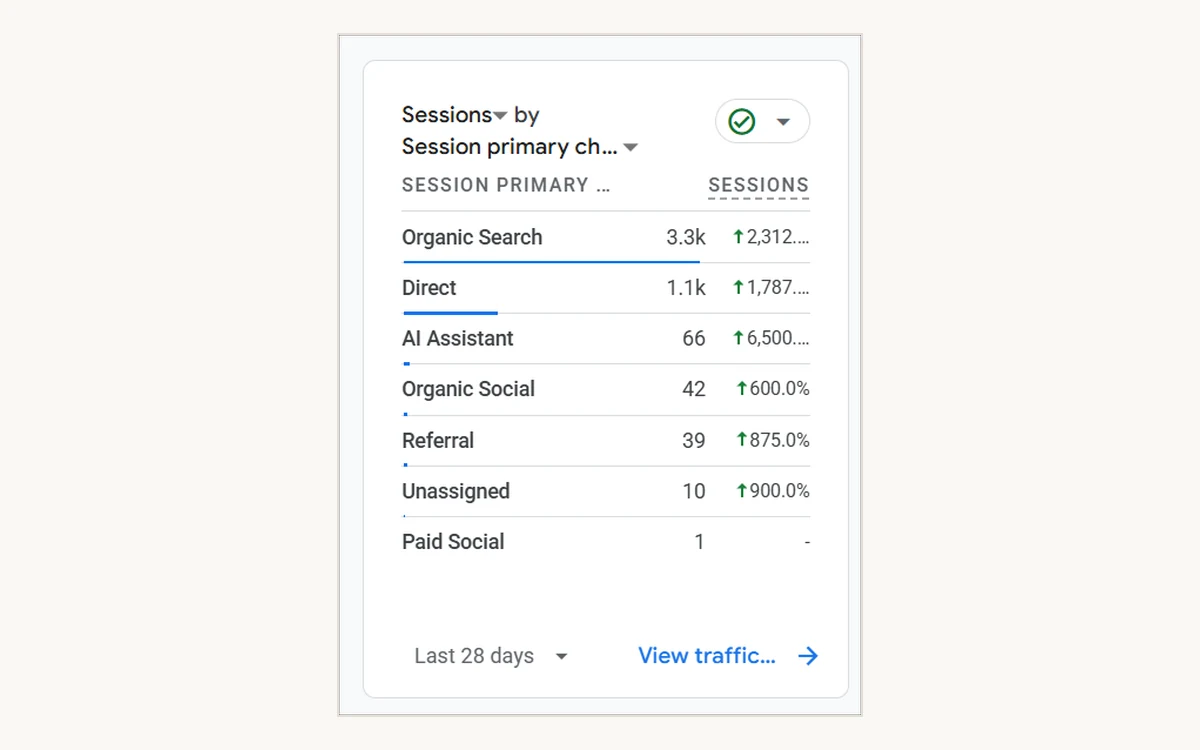
A measurable AI Assistant channel in month one
What it shows. Sessions grouped by channel, with AI assistants reported as a group of their own.
- Organic search 3.3K, direct 1.1K
- AI Assistant 66 sessions
- Paid social: one session
GA4 geography
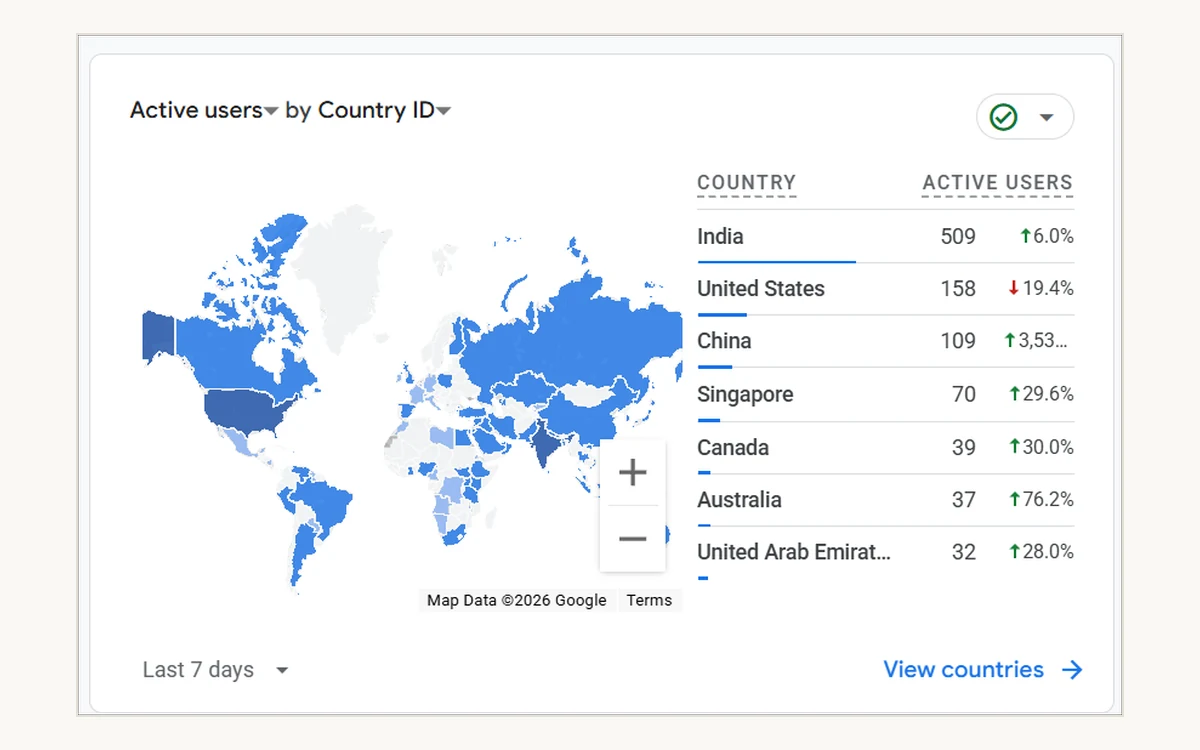
Where the readers actually are
What it shows. The same footprint as the country table above, over a shorter seven-day window.
- India 509, United States 158
- Singapore 70, Canada 39, Australia 37, UAE 32
- China 109 — the bot pattern, shown not hidden
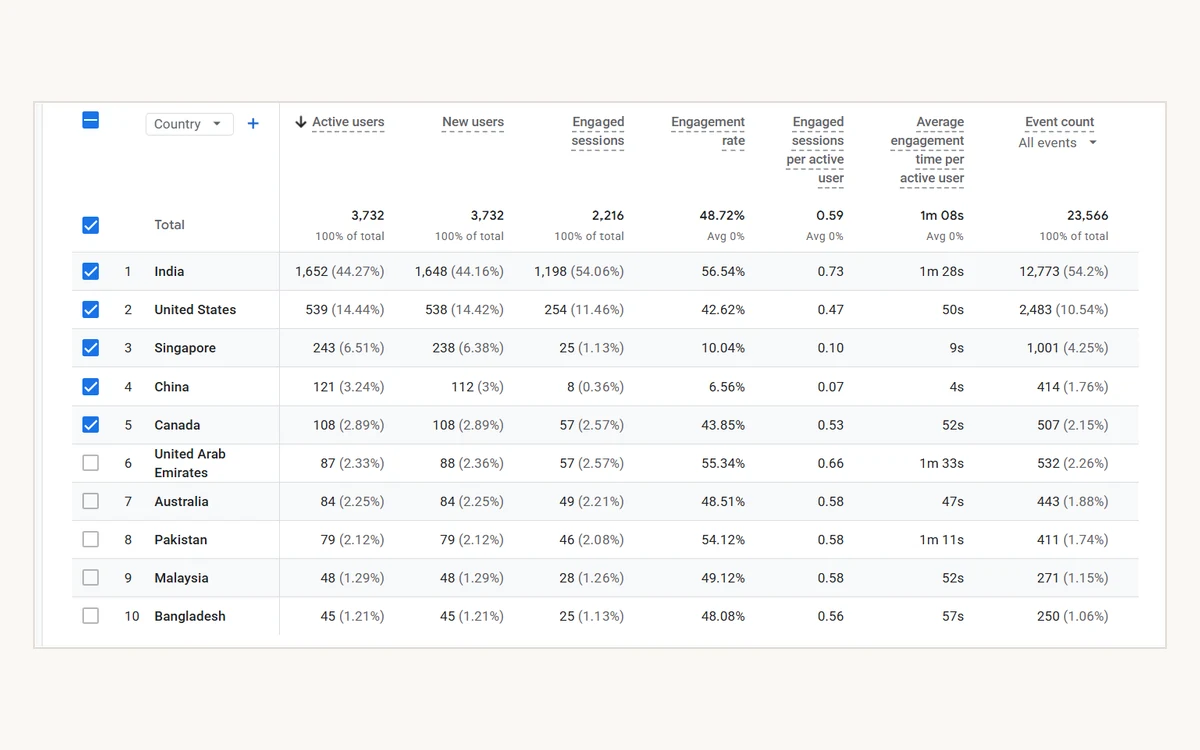
GA4 by country
Engagement time is the column that matters
What it shows. Eight genuine markets, and two that only look like markets.
- UAE reads longest at 1m 33s, India 1m 28s
- Every real market between 47s and 1m 33s
- Singapore 9s and China 4s excluded as bot traffic
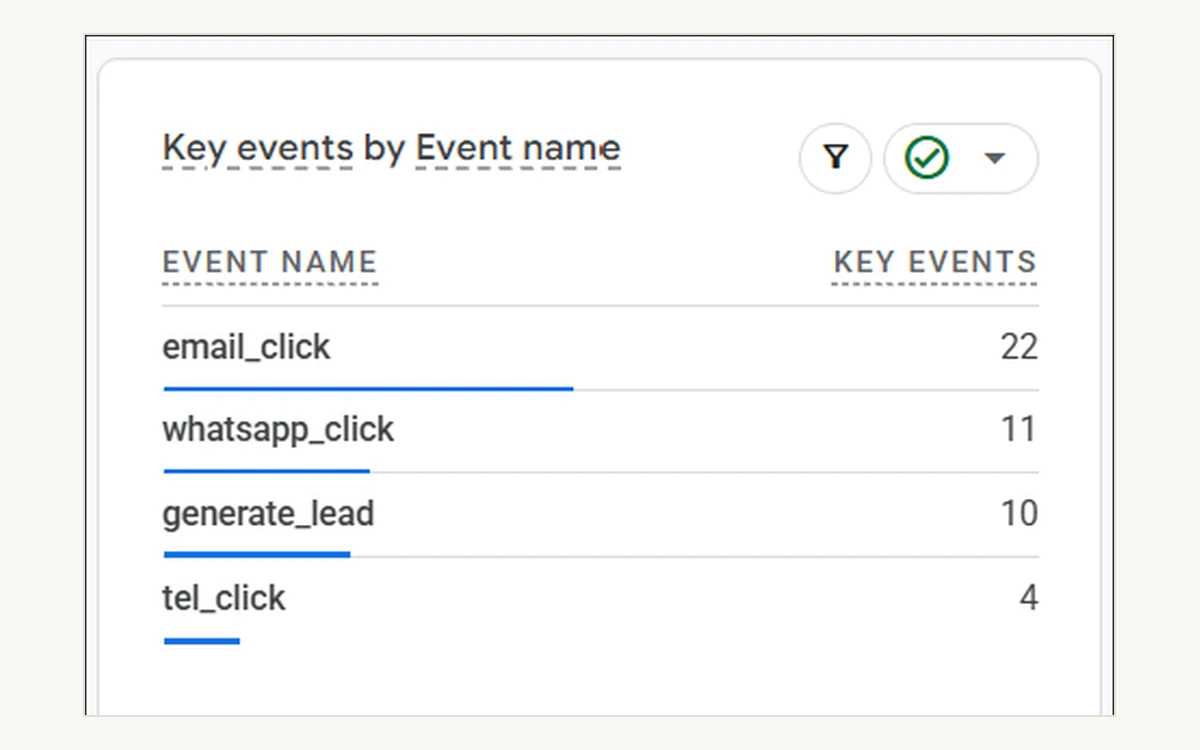
GA4 key events
47 contact actions in month one
What it shows. Every key event GA4 recorded, split by what the visitor actually did.
- 22 email clicks, 11 WhatsApp, 4 phone
- 10 completed enquiry forms
- 1.26% of all users took a contact action
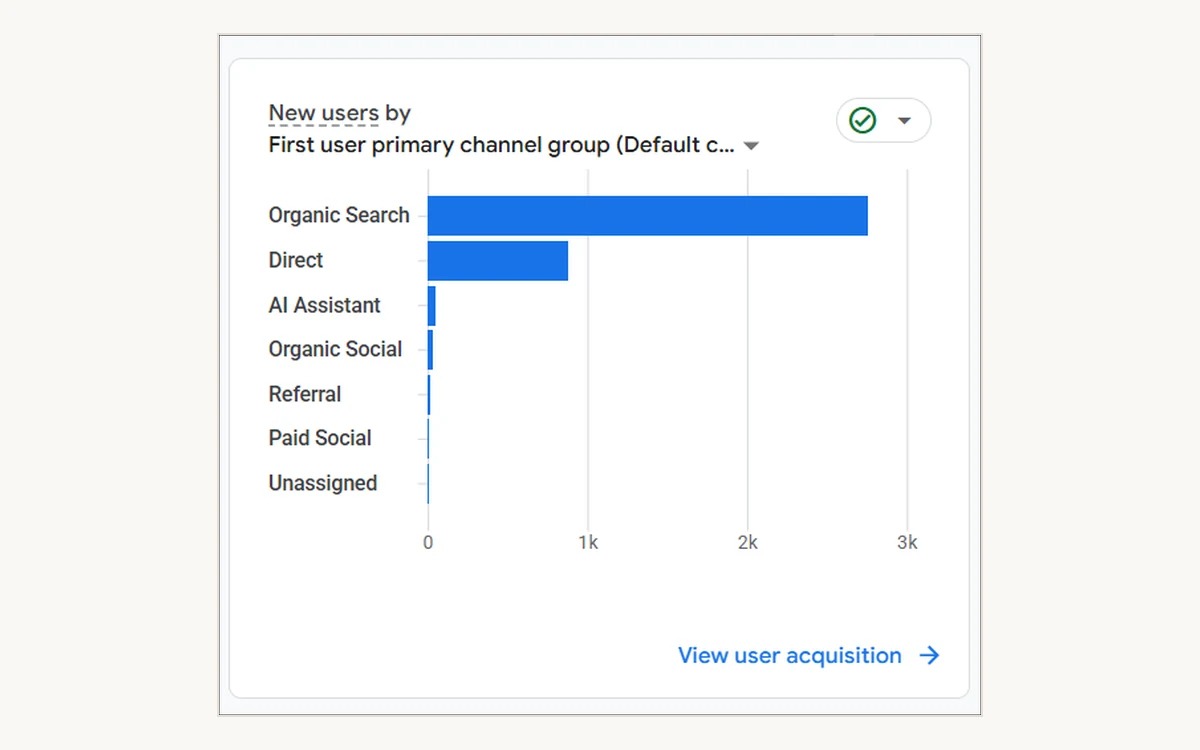
GA4 acquisition
Three in four arrived through organic search
What it shows. First-touch channel for every new user in the window.
- ~2.8K of 3,732 new users from organic
- Direct second, at roughly 900
- Paid social: one session all month
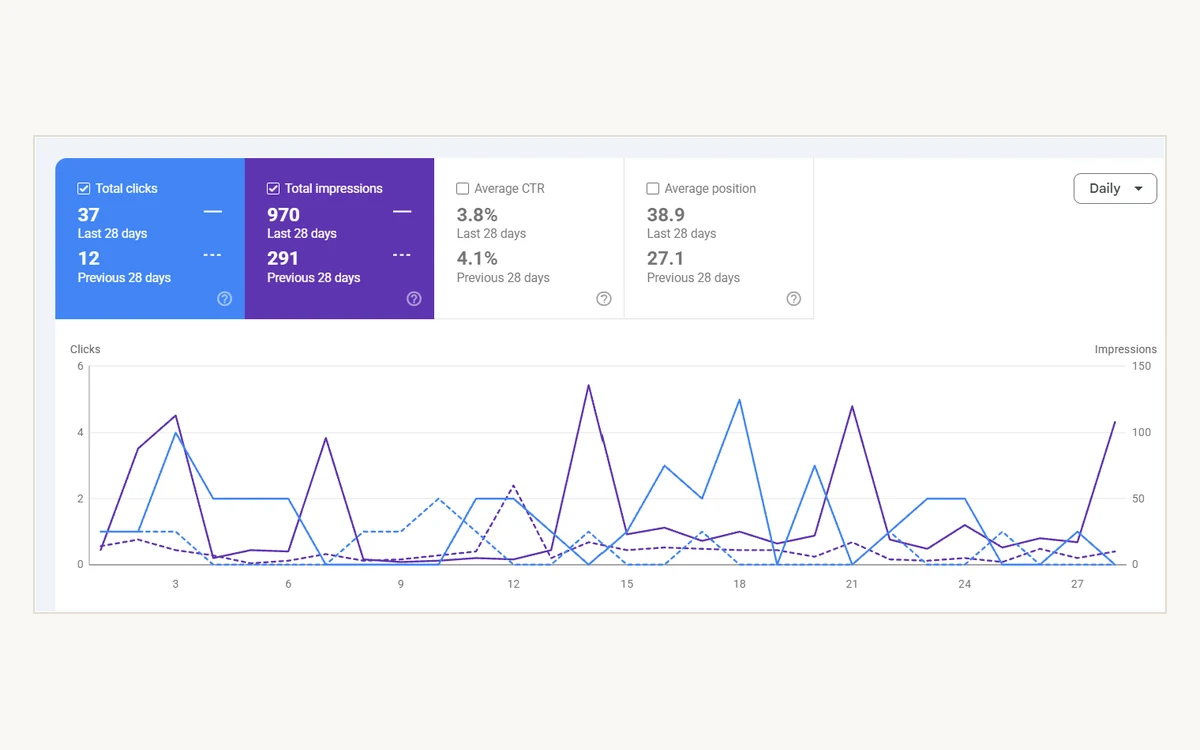
Search Console
An early-stage site, shown as a trajectory
What it shows. A competitive B2C market, eight weeks after launch.
- Clicks 12 → 37 over 28 days
- Impressions 291 → 970
- Base still too small to write up as a result
Your sector
The next card on this page could be yours.
Every engagement opens the same way: a free audit of your actual site, twelve checks, delivered in two working days. No payment details, and the findings are yours whether you hire us or not.
Method
How these numbers are produced.
Sources named on every card
Figures come out of the client’s own Search Console and GA4, which they can open themselves. Where a card uses a third-party rank tracker instead, it says so on the card.
Dated ranges, not best months
Every figure names the window it was measured over, compared against the equivalent preceding period — not against whichever month makes the line steepest.
Totals as reported
Click and impression figures are whole-property totals exactly as Search Console and GA4 report them, over the window named on the card. Nothing is filtered to flatter the line.
Get the audit.
Keep the findings.
Free, no payment details, yours to act on either way.
What you get back
A 12-point audit of your actual site: technical issues blocking indexation, on-page gaps, speed findings, and the three to five fixes we’d make first.
- 2 daysDelivery
- 225Checks run
- ₹0Cost, always