Cohort Analysis for Content Performance (GA4 Method)
How to run cohort analysis on your content in GA4 so you catch traffic decay early, with a step-by-step method, a lifecycle table, and real benchmarks.

Published August 2026. SEO team at PalV’s DM.
Cohort analysis for content performance means grouping the articles or pages you published in the same period (for example, all posts from March 2026) and tracking how that group’s traffic, engagement, and conversions evolve over the following weeks and months, rather than judging content by a single month’s total. Instead of asking “is traffic up this month,” you ask how a typical post performs in month 1 versus month 6 versus month 12. That is the question that actually tells you whether your content strategy is working.
Most teams never ask that second question. They watch the aggregate line on a traffic chart go up and call it a win, even when the gain comes entirely from three viral posts propping up forty quiet ones. Cohort analysis breaks that average apart and shows you which batches of content are actually earning their keep.
Why does content need cohort analysis instead of a monthly traffic report?
A monthly report answers “what happened.” A cohort report answers “what happens to content like this, over time, predictably.” Those are different questions, and only the second one helps you plan next quarter’s editorial calendar.
Here’s the practical problem with month-over-month reporting: it mixes old and new content into one number. If you published 15 posts in January and 15 in July, your July traffic total includes both fresh posts still climbing and January posts that may already be sliding. A single blended chart hides both stories. According to Ahrefs’ 2024 content decay analysis, 66% of pages older than two years see declining organic traffic. That decline is invisible in an aggregate report until it’s already dragged the average down for months.
Cohort analysis fixes this by holding “time since publication” constant as the comparison axis instead of calendar month. You’re no longer comparing January to July. You’re comparing “March cohort at 90 days” to “March cohort at 180 days,” which tells you the actual shape of a post’s lifecycle.
How do you build a content cohort in GA4?
You have two practical routes: GA4’s native Cohort Exploration report, or a spreadsheet built from Search Console and GA4 exports. Both work; the spreadsheet route gives you more control over what counts as a “content” cohort rather than a “user” cohort.
- Define the cohort boundary. Group content by publish month or publish quarter. Monthly cohorts work well if you publish 8+ posts a month; quarterly cohorts suit smaller output.
- Pick your inclusion criteria. Usually this means all blog posts published in that window, tagged consistently in your CMS so you can pull them back out later.
- Choose your metric window. Track each cohort at fixed intervals from publish date: day 30, day 90, day 180, day 365, counted from the day that specific post went live, not the calendar month.
- Pull the data. In GA4, go to Explore > Template Gallery > Cohort Exploration. Set “Cohort Inclusion” to first-touch landing page matching your cohort’s URL pattern, and set the return metric to sessions, engaged sessions, or conversions depending on what you’re measuring.
- Cross-reference with Search Console. GA4 shows engagement and conversions; Search Console shows the click and impression trend that actually predicts whether a piece is decaying or still climbing.
- Plot the curve, not the total. A cohort’s value isn’t one number, it’s a trend line across the intervals in step 3. That shape is what you’re actually trying to read.
If you’d rather not build this from scratch, our team walks through the exact GA4 setup, including event configuration, in GA4 for SEO: The Setup That Answers Real Questions. Pair it with Google Search Console: The Reports That Actually Matter for the click and impression side of the same cohort.
What does a healthy content cohort curve look like?
Most posts follow a recognisable shape: a ramp-up period as Google indexes and starts trusting the page, a peak somewhere between month 3 and month 9, then a plateau or gradual decline. What separates a healthy cohort from a struggling one is the height of the plateau relative to the peak, not the peak itself.
A cohort where posts settle at 60-70% of peak traffic and hold there for a year is healthy. A cohort that falls to 15-20% of peak within six months is a decay pattern that needs intervention, not patience.
| Cohort stage | Typical window | What “healthy” looks like | Warning sign |
|---|---|---|---|
| Ramp-up | Days 0-60 | Steady week-over-week growth in impressions | Flat impressions past day 45 (indexing or relevance issue) |
| Peak | Months 3-9 | Clicks and conversions both rising | Clicks rising, conversions flat (wrong intent match) |
| Plateau | Months 9-18 | Holds 60-70% of peak traffic | Drops below 40% of peak by month 12 |
| Decline | 18+ months | Slow single-digit monthly decline | Sudden 20%+ drop in an 8-12 week window with no seasonal explanation |
That last warning sign, a 20%+ drop over 8-12 weeks with no offsetting demand change, is the general threshold practitioners use to separate normal content aging from active decay that needs a refresh. When a cohort hits it, that’s your cue to move those posts into a refresh queue rather than leaving them to keep sliding.
Which metrics actually belong in a content cohort report?
Not every GA4 metric is useful at the cohort level. Some collapse into noise once you’re tracking dozens of posts across multiple time windows. Stick to metrics that answer a specific question about the cohort’s trajectory:
- Organic sessions by days-since-publish: the core trend line. Everything else is context for this number.
- Engaged sessions rate: GA4’s replacement for bounce rate. Tells you whether traffic quality is holding as volume changes.
- Assisted or last-click conversions: ties the cohort back to business value, not just traffic.
- Average position from Search Console: a leading indicator. Position often slips 4-8 weeks before traffic visibly drops.
- Ranking keyword count: shows whether a post is losing breadth (fewer queries it ranks for) even if the top keyword is stable.
- Internal links pointing to the post: a common, fixable cause of cohort decline that has nothing to do with the content itself.
Six metrics is usually the ceiling before a cohort dashboard becomes unreadable. Pick the ones tied to your actual conversion goal and drop the rest.
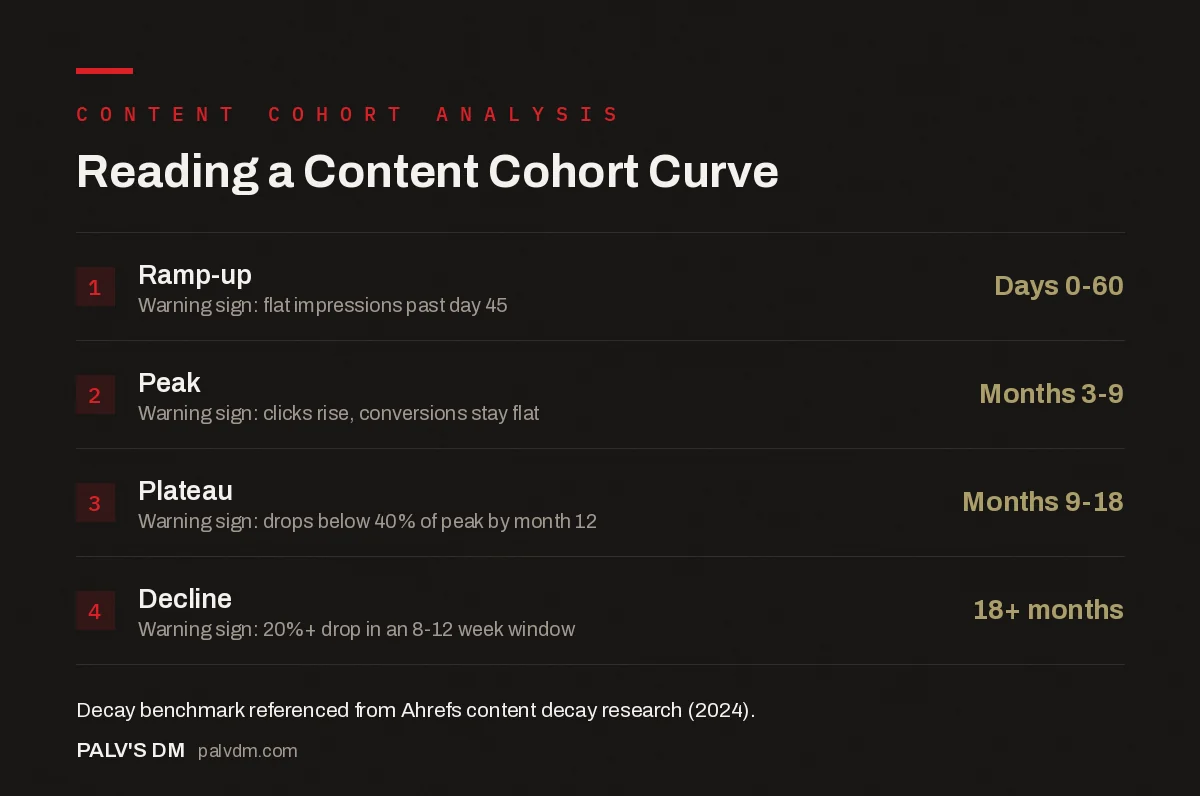
Reading a Content Cohort Curve
- Ramp-up: Days 0-60. Warning sign: flat impressions past day 45.
- Peak: Months 3-9. Warning sign: clicks rise, conversions stay flat.
- Plateau: Months 9-18. Warning sign: drops below 40% of peak by month 12.
- Decline: 18+ months. Warning sign: 20%+ drop in an 8-12 week window.
How often should you review content cohorts?
Quarterly is the right cadence for most teams. Monthly reviews are too noisy at the individual-post level to catch a real trend versus a seasonal blip, and annual reviews catch decay too late to fix cheaply. A quarterly cadence lets you compare the current quarter’s cohort against the same stage of the previous one or two cohorts, which is what turns “traffic dropped” into “this always happens around month 6, and here’s what fixes it.”
Build the review into whatever reporting rhythm your team already runs. If you already do a weekly SEO metrics review, add a cohort check as a quarterly agenda item rather than a separate meeting nobody attends.
What do you do once a cohort shows decay?
Cohort analysis tells you where the problem is. It doesn’t fix it by itself. Once a cohort’s curve drops below your plateau threshold, three moves cover most cases:
First, check Search Console for ranking position changes on the specific queries driving that cohort’s traffic. A slip from position 4 to position 9 explains most of the click loss on its own. Second, audit internal links pointing at the affected posts; link equity erodes quietly as newer content gets published and older posts stop being linked from anywhere. Third, if the content itself is stale (outdated statistics, old screenshots, a changed product feature), it goes into a refresh cycle rather than a rewrite from scratch.
We cover the mechanics of prioritising and executing that refresh work in the content refresh process, start to finish. If you’re trying to decide which pages deserve a refresh versus a full rewrite versus removal, that decision framework is covered in how to score every page as keep, improve, merge or kill.
If your team is running cohort analysis and consistently finding decay you don’t have bandwidth to address, that’s usually a signal the content program needs a structural review rather than one-off fixes. Our SEO Growth service includes a quarterly content performance audit built around exactly this kind of cohort data, so the refresh queue gets prioritised instead of guessed at.
How is cohort analysis different from A/B testing content changes?
Cohort analysis is observational: you watch how groups of content behave over time without changing anything. A/B testing is interventional: you make a specific change and measure the difference against a control. They answer different questions and work best together, since cohort analysis tells you which posts need attention and testing tells you whether your fix actually worked. If you’re weighing structured experiments on your SEO changes, our guide to A/B testing SEO changes covers methods that hold up to scrutiny rather than guesswork dressed up as a test.
FAQ
What’s the difference between cohort analysis and a standard content audit?
A content audit is a point-in-time snapshot: you review every page once and score it. Cohort analysis is a recurring, time-based comparison that tracks how groups of content perform across their lifecycle. Audits tell you where things stand today; cohort analysis tells you the pattern that got you there and predicts what happens next.
How many posts do I need before cohort analysis is worth doing?
You need enough posts per cohort to smooth out one-off outliers, generally 8-10 posts per grouping window. Below that, a single viral post or a single Google update on one page skews the whole cohort’s average. If you publish fewer than that per month, group by quarter instead of month.
Can I do content cohort analysis without GA4’s Explore feature?
Yes. Export Search Console clicks and impressions by page and date, tag each URL with its publish month in a spreadsheet, then pivot by “days since publish” instead of calendar date. It’s more manual than GA4’s Cohort Exploration template but gives you full control over what counts as a cohort.
Does cohort analysis work for landing pages, not just blog content?
Yes, the same logic applies to any page type with a clear publish or launch date, including landing pages, product pages, and pillar pages. The metrics you track will shift toward conversion rate and lead quality rather than pure organic sessions, but the days-since-launch framework stays the same.
How long before a new post’s cohort data becomes meaningful?
Wait at least 90 days before drawing conclusions from a cohort. Google typically takes several weeks to fully index and settle rankings for new content, so day-30 data reflects indexing noise as much as actual performance. The 90-day and 180-day checkpoints are where the real trend starts to show.