Content Marketing ROI: Attributing Revenue to Individual Posts
Content ROI = (revenue attributed minus investment) / investment. See how to calculate it properly, why single-touch attribution misleads, and what to track.

Published: August 2026
Content ROI is calculated as (revenue attributed to content minus content investment) divided by content investment, expressed as a percentage. A program that costs ₹4,00,000 a month and drives ₹12,00,000 in attributed revenue returns 200%. The hard part isn’t the formula, it’s the attribution – deciding which revenue actually traces back to which post, especially when a buyer reads three articles over two months before ever filling out a form.
How do you actually calculate content ROI?
Start with two numbers: total content investment (writer time, editing, tools, any paid promotion) and total revenue you can credibly attribute to content-driven visitors. The formula is straightforward: ROI = ((Revenue Attributed − Investment) / Investment) × 100. A program that spent ₹5,00,000 across a quarter and generated ₹15,00,000 in attributed revenue returns 200% – roughly ₹3 back for every ₹1 spent. Published benchmarks suggest mature content programs commonly land in the 200-300% range once they’ve had enough time to compound, though early-stage programs often run near break-even for the first several months while content is still being indexed and building traffic.
Why is attributing revenue to a single post so hard?
Because most buyers don’t convert on their first visit. A typical B2B or considered-purchase D2C journey involves multiple touchpoints: a blog post that introduces the problem, a comparison page two weeks later, a case study before the final decision. Two flawed shortcuts get used constantly:
- First-touch attribution gives 100% of the credit to the first piece of content a visitor ever saw, ignoring everything that happened between that visit and the eventual purchase.
- Last-touch attribution does the opposite – crediting only the final page before conversion, erasing the educational content that built the buyer’s understanding and trust in the first place.
Both produce a distorted picture. First-touch overvalues top-of-funnel awareness content; last-touch overvalues bottom-of-funnel conversion pages, even when neither would have worked without the other.
What’s a more accurate approach than first- or last-touch?
Multi-touch attribution, which spreads revenue credit across every content touchpoint in a buyer’s journey rather than assigning it all to one. In practice, this means tracking a user across sessions (via GA4 or a CRM), noting every piece of content they engaged with before converting, and distributing credit across those touchpoints – either evenly or weighted toward the touchpoints closest to the actual buying decision. This is more work to set up than a single-touch model, but it stops a genuinely effective top-of-funnel post from looking like it “did nothing” just because the sale closed on a different page weeks later.
| Attribution model | What it credits | Main weakness |
|---|---|---|
| First-touch | The very first content a visitor engaged with | Ignores everything that happened afterward to actually close the sale |
| Last-touch | The final page before conversion | Erases the value of earlier educational content |
| Linear multi-touch | Equal credit across every touchpoint | Doesn’t distinguish a touchpoint that mattered from one that barely registered |
| Position-based (U-shaped) | Heavier credit to first and last touch, some to the middle | Requires more setup; still an approximation, not a perfect measure |
What content investment costs should actually go into the calculation?
Beyond obvious writer fees, a full and honest investment figure includes editing time, any design or image production, distribution costs (paid promotion, email sends featuring the content), and the tools used to research and optimise it – keyword research subscriptions, analytics platforms, and so on. Teams that only count the writer’s invoice and leave out editing, promotion, and tooling systematically overstate ROI, because the denominator in the formula is too small. A more honest calculation, even if it produces a less flattering number, is more useful for deciding whether to keep investing at the current level.
Which content formats actually return the most?
Case studies and customer success stories, video content, and blog posts consistently rank among the highest-ROI formats reported by marketers, according to HubSpot’s State of Marketing research. This tracks with how buyers actually behave – case studies work because they answer the specific “will this work for someone like me” question late in the journey, while blog posts do the earlier work of building awareness and search visibility. Neither format replaces the other; they perform different jobs in the same funnel.
How do you set up tracking to measure this?
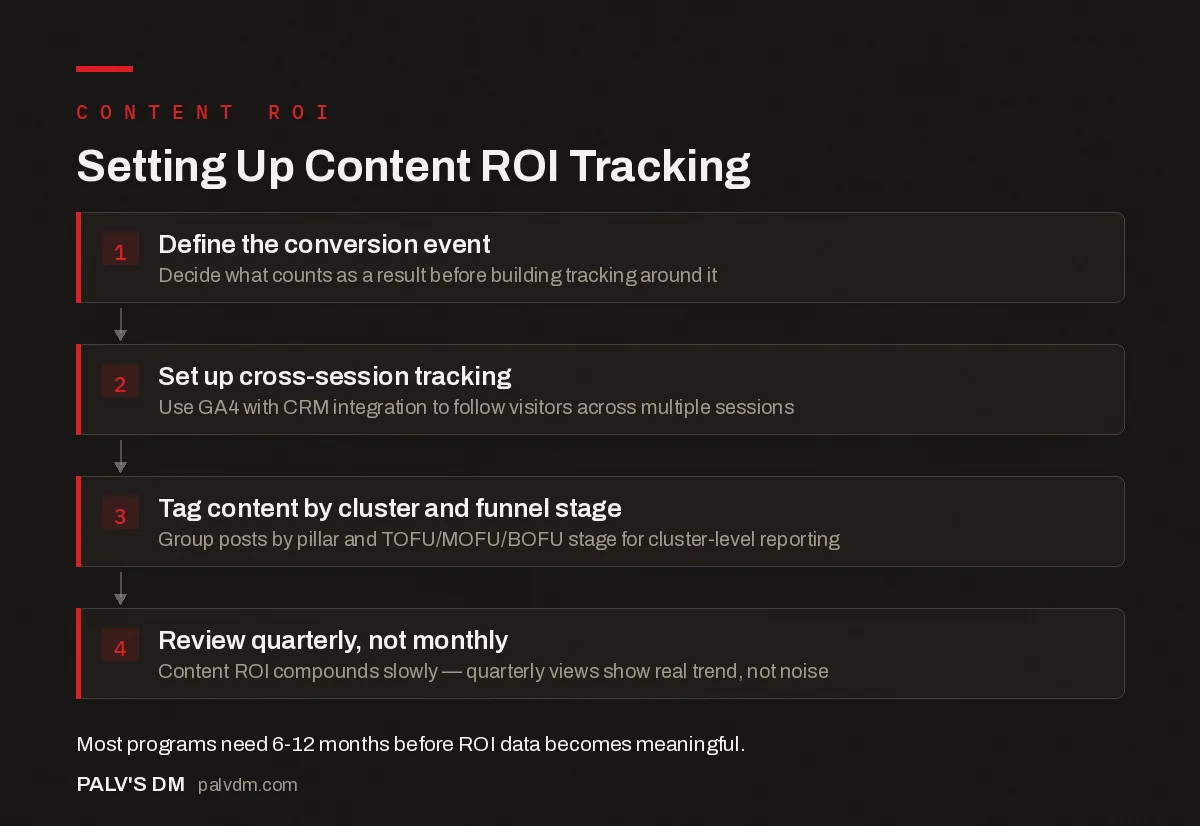
Setting Up Content ROI Tracking
- Define the conversion event. Decide what counts as a result before building tracking around it.
- Set up cross-session tracking. Use GA4 with CRM integration to follow visitors across multiple sessions.
- Tag content by cluster and funnel stage. Group posts by pillar and TOFU/MOFU/BOFU stage for cluster-level reporting.
- Review quarterly, not monthly. Content ROI compounds slowly — quarterly views show real trend, not noise.
How does content ROI differ for TOFU, MOFU, and BOFU content?
Each funnel stage should be judged against a different primary metric, because they’re doing different jobs. Top-of-funnel (TOFU) content is best measured on organic traffic growth, assisted conversions, and its presence in multi-touch paths – not direct revenue. Middle-of-funnel (MOFU) content, like comparison guides or in-depth how-tos, sits closer to the decision and can reasonably be judged on lead generation metrics like form fills or content downloads. Bottom-of-funnel (BOFU) content – pricing pages, case studies, direct comparisons – is the only category where last-touch revenue attribution is a fair primary metric, because that’s the stage it’s designed to influence.
Applying a single ROI metric across all three stages produces a report that looks damning for TOFU and MOFU content even when the overall funnel is working exactly as intended.
What should you do with a post that shows poor ROI?
Check three things before assuming the post failed: whether it’s had enough time (most content needs 3-6 months minimum before ROI data means anything), whether it’s actually getting traffic at all (a zero-traffic post has an attribution problem, not necessarily a content problem), and whether it’s positioned at the wrong funnel stage for the metric being used. A well-written TOFU post judged purely on direct conversions will almost always look like it’s underperforming, because that’s not the job it’s doing. Judge TOFU content on assisted conversions and its role in multi-touch paths, not on last-touch revenue alone.
A worked example: calculating ROI for a real content program
A D2C brand runs a content program with one freelance writer at ₹40,000 a month, an editor spending roughly 6 hours a month at ₹1,500/hour, and a keyword research tool subscription at ₹8,000 a month. Total monthly investment: ₹57,000, or ₹6,84,000 over a year. Over that year, using GA4 with UTM tracking and a position-based attribution model, the brand identifies ₹18,50,000 in revenue where content-driven sessions appeared as a touchpoint in the buyer’s path, weighted toward first and last visits with partial credit to the middle.
ROI = ((18,50,000 − 6,84,000) / 6,84,000) × 100 = roughly 170%. That’s below the 200-300% range mature programs often report, which is expected in year one – most of the content published in the first six months hadn’t had time to rank yet, so the second half of the year did disproportionately more of the work. Re-running the same calculation using only the last six months of investment against the same revenue window would show a notably higher return, which is the more honest number for judging whether the current pace of investment is working.
What are the most common attribution mistakes that inflate or deflate the number?
- Counting only direct-channel revenue. A visitor who reads a blog post, leaves, then returns two weeks later by typing the URL directly gets miscounted as a “direct” conversion with no content credit at all, even though the post is what brought them back.
- Ignoring branded search lift. Content that builds enough awareness for someone to later search the brand name by name doesn’t show up in standard content attribution models, understating content’s real influence.
- Excluding assisted conversions entirely. Looking only at last-touch revenue while ignoring GA4’s assisted conversion data throws away half the picture multi-touch tracking exists to capture.
- Comparing ROI across funnel stages unfairly. Judging a TOFU blog post against a BOFU case study using the same revenue-per-post metric will always make the TOFU content look weaker, even when it’s doing its job correctly.
Fixing these usually moves the number meaningfully without changing anything about the content itself – it’s the measurement that was incomplete, not the program.
FAQ
What’s a good content marketing ROI benchmark?
Mature programs commonly report 200-300% ROI, meaning roughly ₹2-3 returned for every ₹1 invested, once the program has had enough time to build a library of ranking, converting content. Early-stage programs, particularly in the first 6 months, often run near break-even.
How long before content marketing shows a positive ROI?
Most programs need 6-12 months before ROI data becomes meaningful, because both organic rankings and multi-touch attribution data take time to accumulate. Judging ROI at 8 weeks in almost always understates the eventual return.
Can you measure content ROI without a CRM?
Yes, with GA4 goal tracking and UTM-tagged campaigns, though the picture will be less precise than with a CRM that tracks individual contacts across sessions. A CRM makes multi-touch attribution meaningfully more accurate, but GA4 alone still beats no tracking at all.
Should every blog post be judged by direct ROI?
No. Top-of-funnel content is meant to build awareness and enter a buyer’s consideration set, not close the sale directly. Judging it purely on last-touch revenue misrepresents its actual contribution to the funnel.
What’s the difference between content ROI and content ROAS?
ROI measures net return relative to total investment (research, writing, editing, tools). ROAS (return on ad spend) is a narrower metric specific to paid promotion of content. A piece of organic content can have strong ROI with zero ad spend, so ROAS doesn’t apply to most blog content unless it’s being actively promoted.
If proving content’s contribution to revenue has been the missing piece, PalV’s DM’s content writing service builds funnel-stage tagging and internal linking into every post so ROI tracking is possible from day one, not retrofitted later. This post is part of our content strategy guide. Related reading: how long new content takes to rank, publishing volume vs content quality, and how many blog posts per month you need.