Bounce Rate Is Gone. What Engagement Rate Tells You Instead
GA4 replaced bounce rate with engagement rate. Here's exactly how it's calculated, why Google changed it, and how to read it correctly.
Published August 2026. SEO team at PalV’s DM.
GA4’s engagement rate is the percentage of sessions that were “engaged”, lasting 10 seconds or longer, including two or more page views, or triggering a key event, calculated as engaged sessions divided by total sessions. It replaced Universal Analytics’ bounce rate, which measured the opposite: single-page sessions with no further interaction. The two metrics are mathematical complements of each other (engagement rate plus bounce rate equals 100%), but they read very differently, and a “good” engagement rate is high, not low.
What exactly counts as an “engaged session” in GA4?
GA4 defines an engaged session as one that meets at least one of three conditions: it lasted 10 seconds or longer, it included two or more page or screen views, or it triggered at least one key event (a form submission, a purchase, or whatever your business has defined as a meaningful conversion). Any session meeting at least one of these counts as engaged; everything else counts as a bounce, functionally, even though GA4 doesn’t report “bounce rate” as a headline metric by default anymore.
This is a meaningfully different bar than Universal Analytics used. UA’s bounce rate counted any session with exactly one page view and no other interaction as a bounce, including a visitor who spent five minutes reading a single long-form article closely, since no second page view or explicit interaction event occurred. GA4’s 10-second and key-event conditions fix that specific blind spot.
How is engagement rate actually calculated?
Engagement rate equals engaged sessions divided by total sessions, multiplied by 100 for a percentage. If a landing page had 1,000 sessions and 640 of them met the engaged session criteria, the engagement rate is 64%. Bounce rate, where GA4 still shows it in some reports, is simply the inverse: 100% minus the engagement rate, or in this example, 36%.
| UA Bounce Rate | GA4 Engagement Rate | |
|---|---|---|
| What it counts | Single-pageview sessions with no interaction | Sessions 10s+, 2+ pageviews, or a key event |
| Direction of a good number | Lower is better | Higher is better |
| Long single-page reads | Counted as a bounce even at 5 minutes read time | Counted as engaged after 10 seconds |
| Relationship | 100% minus engagement rate | 100% minus bounce rate |
Why did Google make this change in the first place?
UA’s bounce rate had a well-known flaw: it couldn’t distinguish a genuinely disengaged visitor (landed, didn’t like what they saw, left in three seconds) from an engaged one who simply didn’t need a second page (landed, read the entire article they wanted, left satisfied after four minutes). Both counted identically as a “bounce,” which made the metric unreliable for judging content quality on single-page experiences like blog posts or landing pages designed to answer one question fully.
GA4’s engagement rate addresses this directly by adding the time-based and key-event conditions, so a long single-page read no longer looks identical to an instant exit. It’s a more accurate proxy for “did this visit have value,” even though it’s a blunter instrument than actually knowing whether the visitor got what they came for.
Should you treat engagement rate as a ranking factor?
There’s no confirmed evidence that GA4 engagement rate itself is a Google ranking signal, and Google representatives have repeatedly said Analytics data isn’t fed into search ranking algorithms. Its value for SEO is diagnostic, not causal: a low engagement rate on a page that ranks well suggests a mismatch between what the search snippet promises and what the page delivers, which is worth fixing for user and conversion reasons even without a direct ranking effect.
- Use it to prioritise content fixes, not to explain ranking positions directly.
- Compare engagement rate across similar page types rather than site-wide, since a product page and a long blog post have naturally different baseline engagement patterns.
- Look at it alongside key events, not alone, a page can have high engagement rate and still convert poorly, or vice versa.
Does average engagement time replace time on page?
Close to it, but with an important difference in how it’s calculated. GA4 reports “average engagement time per session,” which only counts time while the site had focus in the browser, active tab time, not total elapsed time including a browser tab left open in the background. Universal Analytics’ old “time on page” metric was calculated differently and less reliably, often overestimating attention because it counted elapsed time between pageviews regardless of whether the tab was actually in focus.
This makes GA4’s engagement time a more honest number, but it also means direct year-over-year comparisons against old UA time-on-page data will show what looks like a drop even if actual visitor attention hasn’t changed, the metric got stricter, not the behaviour. Worth flagging to any stakeholder comparing GA4 numbers against old UA historical reports for the first time.
What’s a reasonable engagement rate benchmark?
There’s no single universal number, since engagement rate varies significantly by industry, page type, and traffic source. Organic search traffic to a detailed how-to article typically shows a higher engagement rate than paid social traffic to the same page, because search visitors already have specific intent while social visitors are often browsing more passively. As a rough starting point for comparison purposes:
- Blog and content pages from organic search often land somewhere in the 55-70% range, though this varies widely by niche and content depth.
- E-commerce product pages tend to run lower, since many visitors check one product and leave within seconds of deciding it’s not right for them.
- Landing pages built for a single conversion action can show unusually high engagement rates if the key event itself (a form submit) counts as engagement regardless of time spent.
Rather than chasing an external benchmark, track your own pages’ engagement rate over time and compare similar page types against each other, that comparison is far more actionable than any generic industry number.
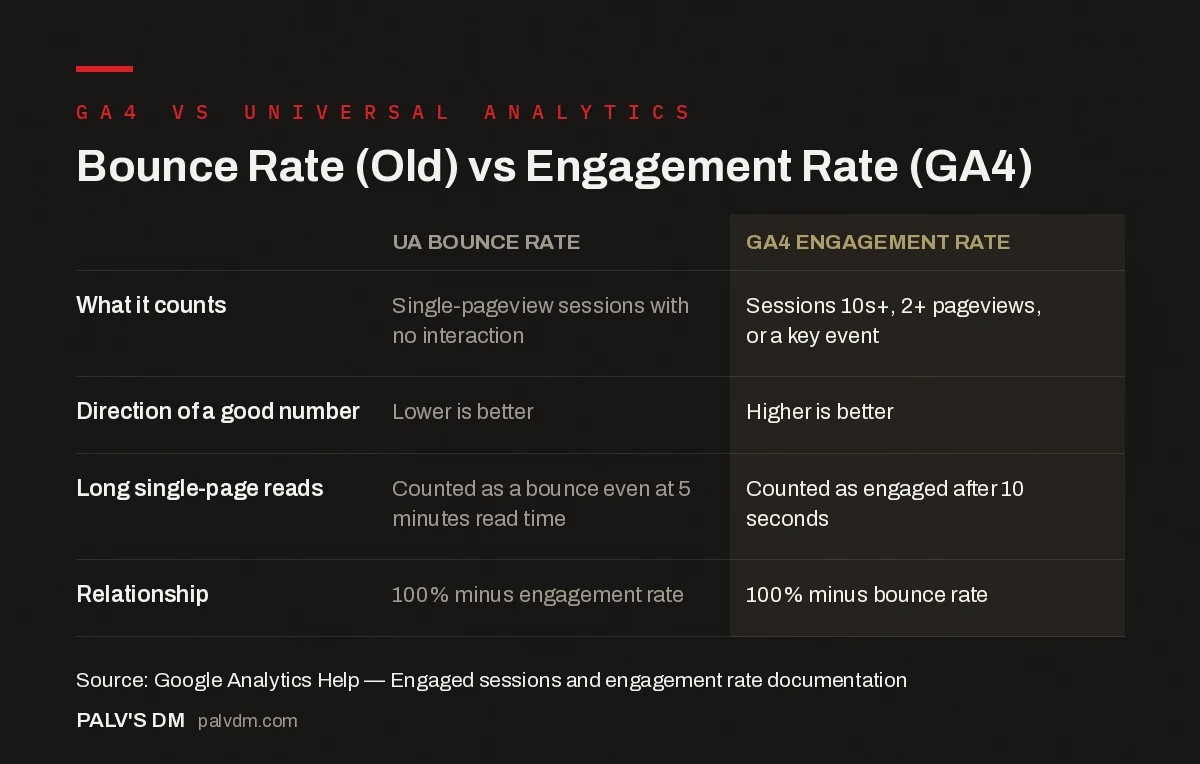
Bounce Rate (Old) vs Engagement Rate (GA4)
| UA Bounce Rate | GA4 Engagement Rate | |
|---|---|---|
| What it counts | Single-pageview sessions with no interaction | Sessions 10s+, 2+ pageviews, or a key event |
| Direction of a good number | Lower is better | Higher is better |
| Long single-page reads | Counted as a bounce even at 5 minutes read time | Counted as engaged after 10 seconds |
| Relationship | 100% minus engagement rate | 100% minus bounce rate |
Teams migrating old UA-era reporting habits into GA4 sometimes keep chasing a “lower is better” number out of habit, which is backwards for engagement rate. Reading this metric correctly, and pairing it with real key events rather than default tracking, is part of the measurement setup we build inside SEO Growth engagements.
For the full setup this metric fits into, see our guide on GA4 for SEO: the setup that answers real questions, and for defining the key events that make engagement rate more than a vanity number, read GA4 events and conversions for a service business. If you’re also tracking AI referral sources, our note on tracking AI referral traffic in GA4 covers a related blind spot in default channel reporting.
How should you compare engagement rate across old UA and new GA4 data?
You largely shouldn’t try to compare them as if they’re the same metric on a continuous timeline. Because the underlying definitions differ this much, a site’s UA bounce rate history and its GA4 engagement rate history are not directly comparable, even accounting for the 100-minus-X inversion. Treat the UA-to-GA4 transition as a reset point: establish a new GA4 baseline over your first full quarter of clean data, then track trends forward from there, rather than trying to stitch the two systems’ numbers into one continuous chart.
What commonly causes a low engagement rate that has nothing to do with content quality?
Before concluding a page’s content is the problem, a few technical and structural causes are worth ruling out first, since they’re often the actual explanation:
- Slow page load speed. A visitor who arrives and waits several seconds for the page to become usable may leave before the 10-second engagement threshold is even reached, regardless of how good the content turns out to be.
- A mismatched search snippet. If the page title or meta description promises something the content doesn’t clearly deliver in the first screen, visitors leave immediately having judged the page as the wrong result, not a bad one.
- Intrusive interstitials or pop-ups. An immediate email capture pop-up or cookie banner covering the content can push a visitor to close the tab before genuinely engaging with anything underneath it.
- Traffic source mismatch. A page receiving a lot of broad, low-intent social traffic will naturally show a lower engagement rate than the same page receiving targeted organic search traffic, independent of the content itself.
Segmenting engagement rate by traffic source and device before drawing conclusions about content quality usually explains a surprising share of what initially looks like a content problem.
How does engagement rate interact with page type when setting internal benchmarks?
A single site-wide engagement rate target rarely makes sense once a site has more than a few distinct page types. A comparison page built to help a visitor make a fast decision might reasonably show a lower engagement rate than a long-form guide, simply because succeeding at its job, helping someone decide quickly, can look identical in the data to someone leaving unsatisfied. Building separate rough benchmarks per page type (blog content, product or service pages, comparison or pricing pages, contact pages) and tracking each against its own trend over time avoids the common trap of comparing a two-paragraph pricing page unfavourably against a 2,000-word guide using the same yardstick.
FAQ
Is a high engagement rate always good?
Generally yes, but context matters. A very high engagement rate paired with very few key events might mean visitors are reading content but not converting, which is a business problem even though the engagement number looks healthy. Always check engagement rate alongside conversion data, not in isolation.
Can I still see bounce rate in GA4?
Yes. GA4 does include a bounce rate metric in some reports and explorations, calculated simply as 100% minus engagement rate. It’s available if you want it, but Google’s default reports emphasise engagement rate as the primary metric going forward.
Why did my engagement rate change dramatically after a redesign?
Check whether page load speed, internal linking, or key event definitions changed alongside the redesign. A slower page can reduce the chance of hitting the 10-second threshold if visitors leave before it finishes loading, and removing internal links can reduce the two-page-view path to engagement.
Does engagement rate account for scroll depth?
Not directly as one of the three qualifying conditions, though GA4’s Enhanced Measurement can track scroll as a separate event, and if that scroll event is marked as a key event, it can contribute to a session qualifying as engaged. By default, scroll alone doesn’t count unless configured to.
Can the 10-second engagement threshold be changed?
No, the 10-second minimum for time-based engagement is fixed within GA4’s standard configuration and isn’t adjustable through the interface. What is adjustable is which events count as key events, which gives you indirect influence over what qualifies a session as engaged through the key-event condition, even though the time threshold itself stays fixed.