Search Console Data Sampling and the 1,000-Row Limit
Google Search Console caps every export at 1,000 rows. Here's what that limit actually means and four practical ways to see your full data.

Published August 2026. SEO team at PalV’s DM.
Google Search Console’s Performance report caps every table you view or export at 1,000 rows, whether or not you’ve applied a filter — this is a hard UI limit, not sampling in the statistical sense. Your site’s real query and page data isn’t being randomly reduced; it’s simply truncated at row 1,000, sorted by whatever column you’re viewing. If your site has more than 1,000 ranking queries in a given period, you’re only seeing a slice, and which slice depends entirely on your sort order.
Is Search Console data actually “sampled” like GA4 can be?
Not in the way most people mean when they say sampling. GA4 sometimes uses statistical sampling on very large properties for certain explorations, extrapolating trends from a subset of data. Search Console doesn’t do this for the numbers themselves — clicks, impressions, and position are all real, unsampled counts. What gets cut is the row count you can see at once: a maximum of 1,000 rows per report view, regardless of dimension.
There’s a separate, smaller form of exclusion worth knowing: Google doesn’t report on “anonymized queries” — searches issued by too few unique users over a rolling window, generally to protect searcher privacy. Those clicks and impressions still count toward your site totals; they just don’t appear as individual query rows. This mostly affects very long-tail or unusual searches, not your core keyword set.
Why does the 1,000-row cap actually matter for a growing site?
For a small site with under 1,000 total queries, this limit is close to irrelevant — you can see essentially everything. The problem shows up as a site scales. A mid-sized e-commerce catalogue or a content site with a few hundred published posts will often have 5,000-20,000+ distinct queries showing impressions in a 3-month window. In the native UI, you only ever see the top 1,000 by whatever sort you’ve picked — usually clicks or impressions descending.
That means the long tail is invisible by default. Low-volume, high-intent queries — the kind that convert well precisely because they’re specific — get cut off before you ever see them, unless you actively filter down to a page, a query pattern, or a narrower date range to shrink the row count below the cap.
What are the real ways to get past the limit?
There are four practical routes, in order of effort:
- Narrow your filters inside the UI. Filtering by page, query pattern (using the “Query containing” filter), device, or country reduces the row count for that specific slice, which can bring it under 1,000 without any tooling.
- Use the Search Analytics API directly. The API supports a
rowLimitparameter up to 25,000 rows per call and astartRowparameter for pagination, letting you pull up to 50,000 rows per day per site per search type. - Use a free connector. Search Analytics for Sheets is a well-known free add-on that automates paginated API pulls into a spreadsheet — no coding required.
- Connect via Looker Studio. Looker Studio’s native Search Console connector pulls from the API rather than the UI, so it isn’t bound by the 1,000-row display cap, and you can build ongoing dashboards on top of it.
- Set up Bulk Data Export to BigQuery. For sites that need full historical granularity, Search Console supports scheduling a daily raw data export to a Google Cloud BigQuery project, with no row limit at all.
| Method | Row limit | Setup effort | Best for |
|---|---|---|---|
| Native UI | 1,000 rows | None | Quick checks, small sites |
| UI with filters applied | 1,000 rows per filtered view | Low | Narrowing to one page or query pattern |
| Search Analytics for Sheets | Up to 50,000 rows/day via pagination | Low-medium | Regular exports without code |
| Search Analytics API (direct) | 25,000 per call, paginated further | Medium-high | Custom tooling, automated pipelines |
| Bulk Data Export to BigQuery | None | High | Full historical analysis at scale |
Does the row limit affect the “Compare” and trend charts too?
The trend chart at the top of the Performance report is calculated from your full underlying data, not from the visible 1,000-row table — so your overall clicks and impressions totals and trend lines are accurate even if the table beneath them is truncated. The cap specifically limits how many individual query or page rows you can inspect at once, not your site-wide totals. This is a useful distinction: if your top-line numbers look right but a specific long-tail query seems to be missing from the table, the cap is almost always the reason, not a tracking problem.
What does the API actually return that the UI doesn’t show?
The Search Analytics API doesn’t unlock secret metrics — it exposes the same clicks, impressions, CTR, and position fields you see in the UI. What changes is the row ceiling and the flexibility of pagination. A single API call defaults to 1,000 rows unless you explicitly raise rowLimit, and you can request up to 25,000 rows per call. To go further, you page through results using startRow, requesting rows 25,001 to 50,000 in a second call, and so on, up to a documented daily cap of 50,000 rows per site per search type.
This is more than enough for the overwhelming majority of SMB and mid-market sites. A catalogue with 10,000 products and a few hundred blog posts will rarely generate more than a few tens of thousands of distinct ranking queries in any three-month window, so the API’s daily allowance covers a full pull without needing BigQuery’s always-on export.
How should an Indian SMB team actually handle this in practice?
Most small business sites in India don’t need BigQuery-level infrastructure. A practical approach:
- Check your total query count first. If Search Console’s summary numbers roughly match what you can see in the 1,000-row table, you don’t have a truncation problem yet.
- Set up Search Analytics for Sheets as a monthly habit once your query count crosses a few thousand — it’s free and takes under 15 minutes to configure.
- Filter by page before exporting if you only need query-level detail for one category or product line, rather than pulling everything at once.
- Reserve the full API or BigQuery route for larger catalogues — typically D2C brands with hundreds of SKUs or content sites publishing several posts a week, where the long tail itself is a meaningful part of the traffic story.
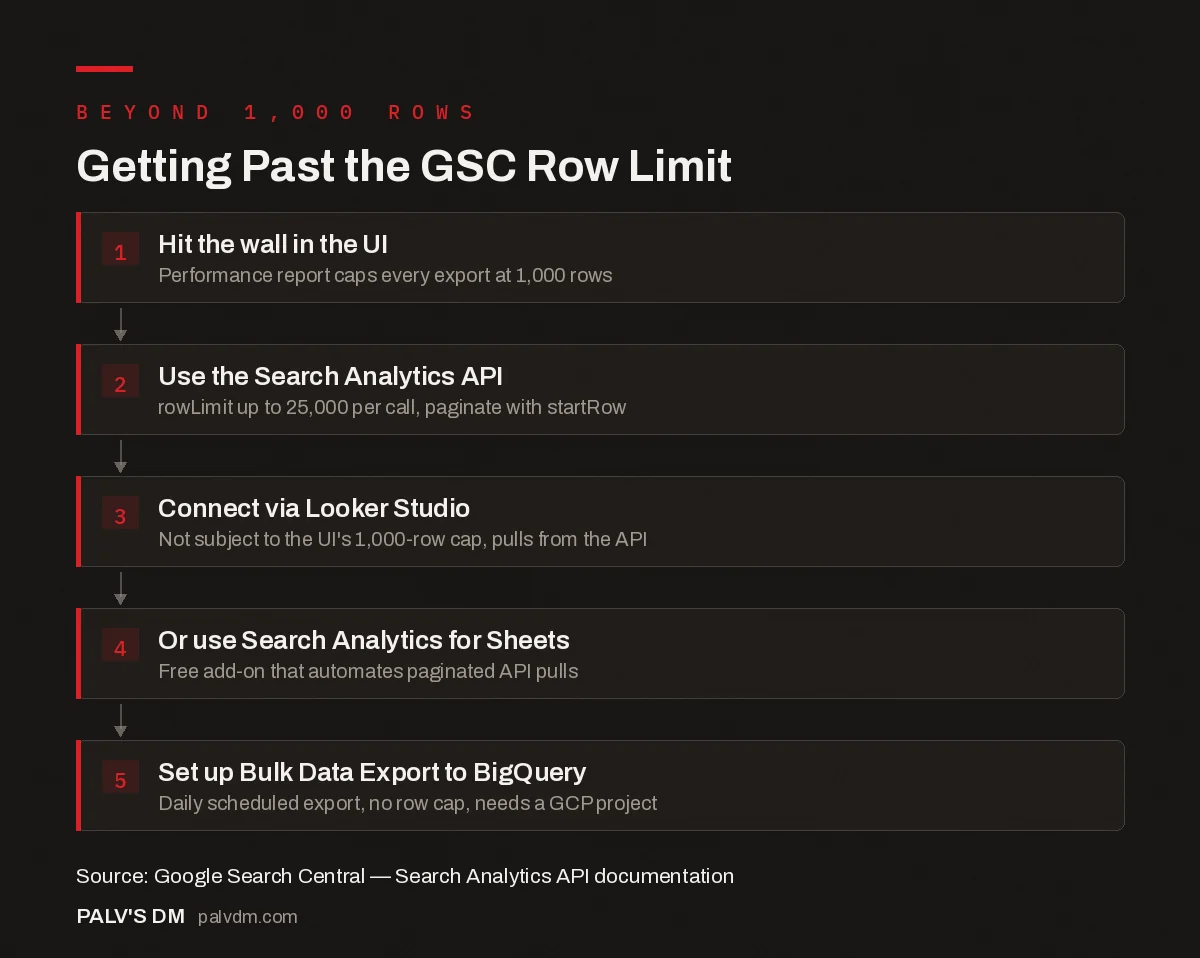
Getting Past the GSC Row Limit
- Hit the wall in the UI. Performance report caps every export at 1,000 rows.
- Use the Search Analytics API. rowLimit up to 25,000 per call, paginate with startRow.
- Connect via Looker Studio. Not subject to the UI’s 1,000-row cap, pulls from the API.
- Or use Search Analytics for Sheets. Free add-on that automates paginated API pulls.
- Set up Bulk Data Export to BigQuery. Daily scheduled export, no row cap, needs a GCP project.
Working with truncated data without realising it leads to two common mistakes: assuming your long-tail keyword coverage is thinner than it is, and missing early cannibalisation signals that only show up once you can see queries ranked 800th to 3,000th by impressions. Getting the full picture is part of the reporting work we do inside SEO Growth engagements, alongside broader guidance in our Google Search Console guide.
If row limits are distorting how you read query and page data together, it’s worth pairing this with our notes on reading Query vs Page vs Page+Query views and on comparing date ranges without fooling yourself, since both compound the row-limit issue in different ways.
FAQ
Does the 1,000-row limit mean I’m losing 90% of my data?
No. Your site-wide totals — total clicks, impressions, and average CTR — are calculated from complete data, not the visible table. The limit only restricts how many individual query or page rows you can see listed at once. A site with 1,200 queries is only “missing” the bottom 200 rows in the table view, not 90% of anything.
What’s the fastest free way to see more than 1,000 rows?
Search Analytics for Sheets, a free Google Sheets add-on, automates paginated calls to the Search Analytics API and drops the results into a spreadsheet. It requires no coding and typically takes under 15 minutes to set up for a first export.
Is Looker Studio actually free to connect to Search Console?
Yes. Looker Studio’s Search Console connector is free to use and isn’t limited by the 1,000-row UI cap, since it queries the API directly. The tradeoff is a small learning curve in building your first dashboard, though Google provides a template gallery to start from.
Why do some queries not show up in Search Console at all?
Very low-frequency or unusual searches can be excluded as “anonymized queries” to protect searcher privacy — this applies to queries issued by very few unique users over a rolling multi-month window. Their clicks and impressions still count in your site totals but won’t appear as individual rows.
Does the row limit apply per day, per dimension, or per report?
It applies per report view in the UI — each time you load or export the Performance table for a given set of filters and dimensions, you get up to 1,000 rows for that specific view. Changing filters, date ranges, or dimensions generates a new 1,000-row allowance for that new view.