Identifying Which Pages Drive Revenue, Not Just Sessions
Traffic alone hides your best pages. Here is how to build a GA4 revenue-per-session report that ranks pages by what they actually earn.

Published August 2026. Written by the SEO team at PalV’s DM.
To find which pages actually drive revenue rather than just traffic, add the Landing Page dimension to a GA4 report alongside a revenue or conversion metric, filter to organic search, exclude branded-query sessions, and rank pages by revenue per session instead of total sessions. A page with 500 monthly sessions converting at 3% is worth more to the business than a page with 5,000 sessions converting at 0.1%, and traffic-only reports hide that distinction completely.
Why does session count alone mislead?
Total sessions measures how many people arrived. It says nothing about what they did next. A blog post that ranks well for a broad informational term can pull in thousands of monthly visitors who read one paragraph and leave, while a narrower, more specific page pulls in a fraction of the traffic but converts at a much higher rate because the visitors arriving there are closer to a buying decision.
Reporting that leads with sessions, or worse, ranks content performance by traffic alone, routinely pushes teams to invest more in the high-traffic, low-value page and less in the low-traffic, high-value one. That’s the opposite of where the next hour of SEO work should go.
How do you set up a page-level revenue report in GA4?
Five steps get most sites to a working report:
- Add Landing Page as the primary dimension. In GA4, go to Reports > Engagement > Landing page, or build a custom exploration with Landing Page as the row dimension.
- Add a revenue or conversion value metric as the column. For ecommerce sites, use Purchase Revenue. For lead-gen or service businesses, use a conversion value assigned to your primary goal event, such as a form submission or booked call.
- Filter to organic search traffic. Set Session default channel group equals Organic Search, so paid, email, and direct traffic don’t dilute the picture of what SEO specifically is driving.
- Exclude branded-query sessions where possible. Someone who searched your company name and landed on your homepage isn’t a good test of whether a specific piece of content is driving revenue. Segment this out for a cleaner non-branded view.
- Sort by revenue per session, not total revenue or total sessions. This single sorting change is what surfaces the pages worth more attention than their traffic volume suggests.
How do you connect page-level revenue back to specific queries?
GA4 shows which page drove a conversion. Google Search Console shows which queries brought traffic to that page. Neither tool alone answers “which keyword drove this revenue,” but combining them gets close. Export landing page performance from GA4 and query-to-page performance from GSC for the same date range, then join the two datasets by URL. The result shows, for each page, both the queries driving traffic and the revenue that traffic produced, which is the closest most sites can get to keyword-level revenue attribution without a dedicated BigQuery pipeline.
For sites with a Google Search Console and GA4 integration already connected, some of this join happens automatically inside GA4’s Search Console reports, though the native integration surfaces clicks and impressions more readily than a clean revenue-per-query breakdown. A manual export and spreadsheet join still tends to produce the most reliable page-and-query-level revenue view for a mid-sized site.
What does a page-level revenue report actually reveal?
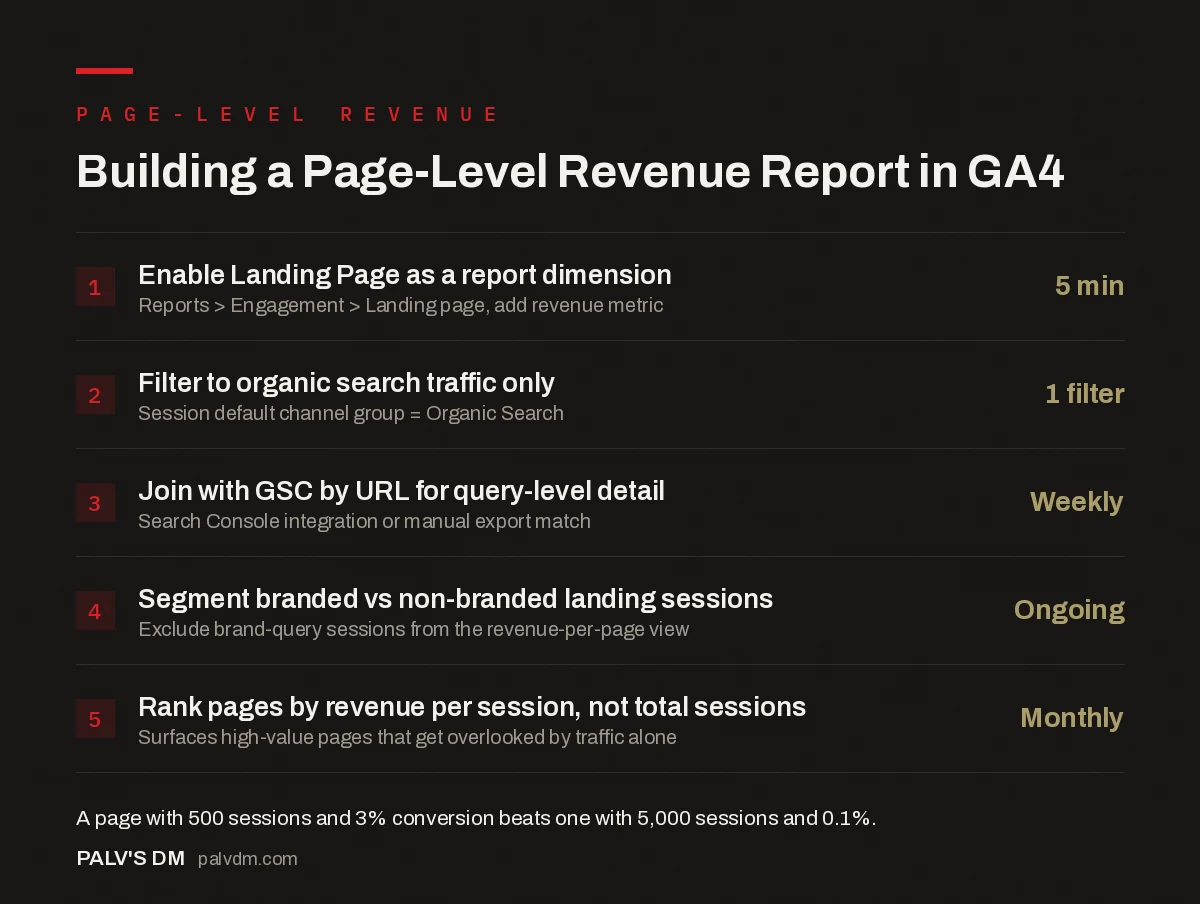
Building a page-level revenue report in GA4
- Enable Landing Page as a report dimension. Reports > Engagement > Landing page, add a revenue metric.
- Filter to organic search traffic only. Session default channel group equals Organic Search.
- Join with GSC by URL for query-level detail. Search Console integration, or a manual export match.
- Segment branded vs non-branded landing sessions. Exclude brand-query sessions from the revenue-per-page view.
- Rank pages by revenue per session, not total sessions. Surfaces high-value pages that get overlooked by traffic alone.
In practice, this report typically surfaces three categories of page worth acting on differently. Pages with high traffic and high revenue per session are working as intended and deserve continued investment. Pages with high traffic and low revenue per session are attracting the wrong intent, or converting poorly for a fixable reason like a weak call to action or a mismatched offer. Pages with low traffic and high revenue per session are under-promoted relative to their value, and often the best candidates for additional internal links or a content refresh aimed at expanding their reach.
Table: what to do with each page category
| Traffic level | Revenue per session | Likely diagnosis | Action |
|---|---|---|---|
| High | High | Working as intended | Protect ranking, keep content fresh |
| High | Low | Wrong intent or weak conversion path | Review CTA, offer match, and search intent alignment |
| Low | High | Under-promoted relative to value | Add internal links, expand topical coverage |
| Low | Low | Low priority | Deprioritise or consolidate with a stronger page |
How often should this report run?
Monthly, at minimum, for sites with enough conversion volume to make the data meaningful. For lower-traffic sites where individual pages might see only a handful of conversions a month, a quarterly view with a rolling 90-day window smooths out the noise that a single slow or unusually strong month can introduce into a monthly comparison.
What’s a practical example of this report changing a decision?
Consider a D2C brand with two organic landing pages. The first, a broad “buying guide” post, pulls 4,800 sessions a month and generates ₹1,90,000 in attributed revenue, a revenue-per-session figure of about ₹40. The second, a narrower comparison page for a specific product pairing, pulls only 620 sessions but generates ₹1,05,000, a revenue-per-session figure of roughly ₹169, more than four times higher.
A traffic-only report would rank the buying guide as the stronger asset and likely direct the next round of content investment toward similar broad guides. The revenue-per-session view flips that: the comparison page is converting at a rate that suggests it should be getting more visibility, not less, through additional internal links from related pages and possibly an expanded content cluster around similar comparison queries. That’s a materially different content roadmap than the one traffic alone would have produced.
What mistakes make a page-level revenue report unreliable?
A handful of setup issues consistently distort page-level revenue numbers before the analysis even starts:
- Attributing revenue to the landing page instead of the converting page. A visitor might land on a blog post, browse to three other pages, then convert on the product page. Standard GA4 attribution credits the landing page for that session by default in many report views, which understates the pages doing real closing work later in the visit. Check which attribution setting the report is actually using before trusting the page-level split.
- Not excluding internal traffic. Team members, QA testers, and anyone browsing the site while logged into an internal account can inflate session counts and distort conversion rates on pages that get frequent internal review, particularly newly published ones. Filter internal IP ranges or use GA4’s internal traffic rule before trusting early performance data on a new page.
- Ignoring multi-session buyers. A buyer who visits three times across two weeks before converting may show three separate sessions across different landing pages in a session-scoped report, splitting credit in a way that understates whichever page actually closed the sale. A user-scoped or cross-session view corrects for this but requires more setup than the default session report.
- Comparing revenue-per-session across pages with very different traffic volume. A page with 40 monthly sessions and one high-value conversion can show an inflated revenue-per-session figure that looks impressive but isn’t statistically meaningful yet. Treat revenue-per-session on low-traffic pages as directional until session counts climb into the low hundreds.
None of these invalidate the page-level approach. They’re reasons to sanity-check a surprising number against a second data source, GSC or a CRM export, before acting on it as if it were settled.
Frequently asked questions
What counts as a good revenue-per-session benchmark?
There’s no fixed benchmark, since it depends entirely on average order value or lead value and overall site conversion rate. The more useful comparison is relative: rank all organic landing pages by revenue per session and look at the distribution across your own site. Pages significantly below your site’s median for a comparable content type and funnel stage are the ones worth investigating first.
Do I need GA4’s ecommerce tracking set up for this to work?
For product sales, yes, accurate ecommerce tracking with purchase revenue events is required for a true revenue figure. For lead-generation or service businesses without a direct purchase event, assign a modelled value to your primary conversion event, such as a qualified form submission, based on your historical close rate and average deal size, then use that value in place of purchase revenue throughout the report.
Why does a page show traffic in GSC but no sessions in GA4?
This usually points to a tracking gap rather than a data error, most often a missing or misconfigured GA4 tag on that specific page template, a redirect that GA4 isn’t capturing correctly, or a discrepancy between how GSC counts a click and how GA4 counts a session (bounced sessions under a few seconds sometimes don’t register fully). Check the page’s tracking implementation directly before trusting either number in isolation.
Should informational blog content be judged by the same revenue-per-session standard as commercial pages?
Not directly. Top-of-funnel informational content plays a different role, often assisting a conversion that happens later on a different page rather than converting directly itself. Judge informational pages partly on assisted conversions, pulled from GA4’s multi-touch attribution data, rather than only on direct revenue per session, or you’ll systematically undervalue content doing legitimate upper-funnel work.
The bottom line
Sessions measure attention. Revenue per session measures whether that attention is worth anything. Building a page-level view that filters to organic, excludes branded noise, and sorts by revenue rather than volume routinely surfaces both underperforming high-traffic pages and underpromoted high-value ones, neither of which shows up in a standard traffic report.
PalV’s DM’s SEO Growth service includes page-level revenue reporting as a standard part of monthly analysis, not a one-off audit.
For the broader ROI number this feeds into, see our guide to calculating SEO ROI. For rankings that haven’t converted yet, our post on assigning value to a keyword ranking covers how to estimate their worth in the meantime. To understand how credit gets split across a multi-touch journey, read attribution models and why SEO looks underpaid. Our Google Search Console guide covers the query-level data this report joins against.