SEO Forecasting: Building a Defensible Traffic Model
A defensible SEO traffic forecast needs real position data, a CTR curve, seasonality, and a published range. Here is the five-step model.

Published August 2026. Written by the SEO team at PalV’s DM.
A defensible SEO traffic forecast starts with keyword-level search volume and current ranking position, applies a click-through-rate curve by position, models realistic (not best-case) ranking movement, adjusts for seasonality, and publishes a range instead of a single number. Skip the range and present one confident figure, and the first month that misses the target undermines every forecast that follows it.
What inputs does an SEO forecast actually need?
Four data sources feed a credible model:
- Search volume per target keyword, from Google Search Console impressions data or a keyword research tool. GSC’s own historical impression data is often more accurate than third-party volume estimates, because it reflects your actual visibility, not a modelled industry average.
- Current ranking position, tracked weekly at minimum, for every keyword in the forecast. A forecast built on stale position data from three months ago is a forecast of where you used to be.
- Click-through rate by position, ideally your own site’s curve rather than a generic industry curve. CTR varies significantly by query type, brand recognition, and whether AI Overviews or other SERP features are eating into position-1 clicks for that query.
- Conversion rate by landing page, from GA4, to translate a traffic forecast into a revenue forecast if that’s the end goal.
How do you model realistic ranking movement?
The single biggest forecasting error is assuming every target keyword climbs to position 1. It won’t. A defensible model segments keywords by current position band and assigns different, evidence-based movement assumptions to each band:
| Current position | Typical realistic 6-month movement | What drives it |
|---|---|---|
| Position 11-20 | Move into top 10 for roughly a third of keywords in this band with sustained content and link work | Coverage gaps, on-page fixes, internal linking |
| Position 4-10 | Move into top 3 for a smaller share, depending on competitiveness | Authority signals, content depth, page experience |
| Position 1-3 | Largely holds position; upside is defensive, not growth | Maintaining freshness and fending off competitor moves |
| Not ranking (position 21+) | Low probability of reaching page 1 within 6 months without new content | New page creation, topical authority build-out |
Assigning uniform optimism across every band is the fastest way to produce a forecast that looks impressive in the deck and falls apart against actuals three months later.
How does click-through rate change the picture?
Search volume and position alone don’t produce a traffic number. Position has to run through a CTR curve to become an estimated click count, and that curve is not flat: position 1 organic results historically capture a large share of clicks for a given query, with a steep drop-off by position 3 and a much smaller share by position 10. The exact numbers vary by query and by how much a SERP is now occupied by AI Overviews, featured snippets, and ads above the fold, all of which push organic CTR down even at position 1.
Where possible, build the CTR curve from your own GSC data rather than borrowing an industry-average curve. If a site has at least 1,000 clicks of history across a range of positions, GSC’s actual click and impression data per position produces a more accurate curve than any generic benchmark, because it already reflects how much AI Overviews and other features are eating into your specific SERPs.
How do you account for seasonality?
Pull 12 to 24 months of historical GSC data and calculate a month-over-month index: what share of annual traffic each month typically represents. A B2B SaaS site and a festive-season D2C brand will have very different seasonal curves, and applying a flat monthly growth rate to either ignores a pattern the historical data already shows. Layer the seasonality index over the position-based growth projection so the forecast dips and rises where the business actually does, rather than assuming linear month-over-month growth.
Why does the forecast need a range, not a single number?
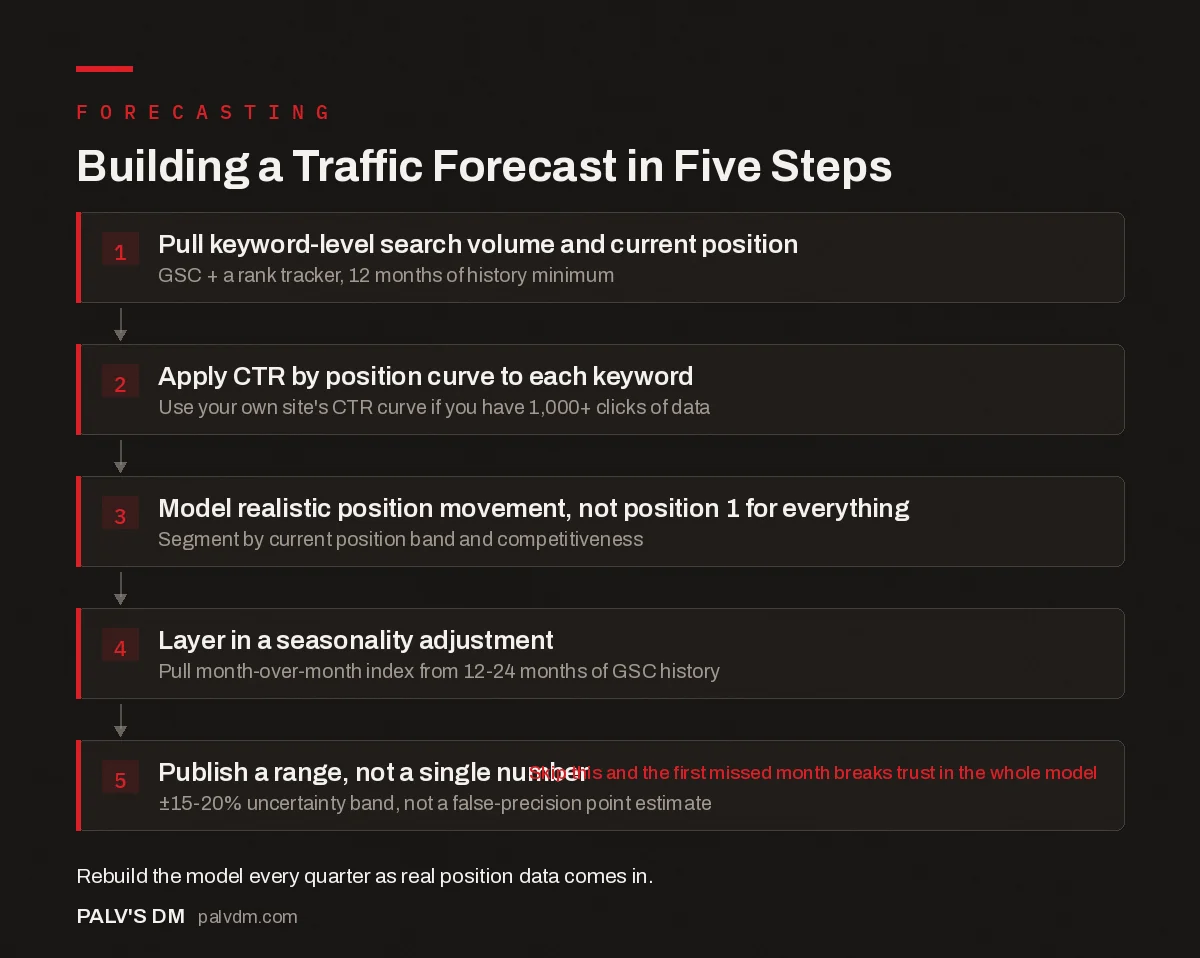
Building a traffic forecast in five steps
- Pull keyword-level search volume and current position. GSC plus a rank tracker, 12 months of history minimum.
- Apply a CTR-by-position curve to each keyword. Use your own site’s CTR curve if you have 1,000+ clicks of data.
- Model realistic position movement, not position 1 for everything. Segment by current position band and competitiveness.
- Layer in a seasonality adjustment. Pull a month-over-month index from 12-24 months of GSC history.
- Publish a range, not a single number. A ±15-20% uncertainty band, not a false-precision point estimate.
A single-number forecast implies a precision the underlying data doesn’t have. Google’s own algorithm updates, competitor content pushes, and shifts in how much a SERP feature eats into organic clicks all introduce variance no model can fully predict. A ±15-20% uncertainty band around the central estimate is a more honest representation of what a forecast actually is: a range of plausible outcomes, not a promise.
Publishing a range also protects the credibility of the next forecast. If a single point estimate misses, the entire model looks broken. If a range was published and the actual result landed inside it, the model did its job, even if the outcome landed at the low end.
How often should the forecast be rebuilt?
Quarterly, at minimum, using real position and traffic data from the prior quarter to recalibrate the assumptions. A forecast built once at the start of a campaign and never revisited drifts further from reality every month, because it can’t account for algorithm updates, new competitor content, or keywords that moved faster or slower than the model assumed. Treat the forecast as a living document, not a one-time deliverable.
What’s a common mistake that undermines an SEO forecast?
Treating the forecast as a target rather than a projection is the most damaging one. When a forecast gets handed to a sales or leadership team as a commitment, the incentive quietly shifts from “build the most accurate model” to “build a model that hits the number we already promised.” That pressure shows up as optimistic position assumptions and a narrower uncertainty band than the data supports, which is exactly backwards. The teams with the most credible long-term forecasts are usually the ones who were willing to publish a wide range and a modest central estimate early on, then tightened the range as real data proved the model out over several quarters.
A second common mistake is forecasting total organic traffic instead of the specific segment that matters. Total organic sessions can grow while non-branded, commercially relevant traffic, the segment that actually predicts new revenue, stays flat or declines. Forecast the segment tied to the business outcome, not the vanity metric that’s easiest to pull.
Frequently asked questions
How accurate can an SEO forecast realistically be?
Within a well-built ±15-20% band, most defensible forecasts land inside the range more often than not, particularly for established sites with 12+ months of stable historical data. Forecasts for brand-new sites or entirely new keyword clusters carry far more uncertainty, because there’s no historical position or CTR data to anchor the model. Widen the range accordingly rather than presenting false confidence.
Should I forecast traffic or revenue?
Build the traffic forecast first, since it’s the more defensible half of the model, then layer a conversion rate on top to produce a revenue estimate. Presenting only a revenue number without showing the traffic and conversion assumptions underneath makes the forecast much harder to audit or trust when someone asks how the number was derived.
What tools do I need to build this without SEMrush or Ahrefs?
Google Search Console provides the core inputs at no cost: impressions, clicks, average position, and 16 months of trailing history. A spreadsheet with a CTR-by-position table and a seasonality index, both built from your own GSC export, gets a defensible forecast built without a paid tool. Paid rank trackers add convenience and competitor visibility, not a fundamentally different forecasting method.
Why did my actual traffic miss the forecast?
Check three things first: whether a core algorithm update landed during the forecast period, whether a competitor published significant new content in the same cluster, and whether a SERP feature like an AI Overview started appearing on target queries and eating into the CTR curve the forecast assumed. Any of the three can move actual results outside even a well-built range, and identifying which one happened is more useful than simply noting the miss.
The bottom line
A forecast a stakeholder can trust is built from real position and CTR data, models believable movement by position band rather than universal wins, adjusts for seasonality using actual history, and presents a range instead of one confident number. Rebuild it quarterly as real data replaces assumptions, and the model gets more accurate with every cycle rather than staying frozen at launch-day guesswork.
PalV’s DM’s SEO Growth service includes a quarterly forecasting model built from your own Search Console history, not a generic industry template.
To turn a forecast into a number finance will sign off on, see our guide to calculating SEO ROI. For the attribution question that affects how forecasted traffic gets credited, read why SEO always looks underpaid. If a keyword is ranking but hasn’t converted yet, our post on assigning value to a keyword ranking covers how to size that opportunity. Our Google Search Console guide covers the reports this model pulls from.