Building a Client Reporting System That Scales Past Five Accounts
How to build an SEO client reporting system that doesn't collapse past five accounts: what to automate, what tool to pick, what to keep manual.

A client reporting system that scales separates two things most freelancers and small agencies bundle together by default: pulling the numbers, and writing what they mean. The first part should be almost entirely automated. The second part should never be, because a client can tell the difference between a real update and a templated paragraph within about two reports.
Reporting is the thing that quietly eats an agency alive as it grows. At three clients, a manual spreadsheet and a monthly screen-share is fine. At fifteen, that same process either breaks or starts consuming a day and a half every month that should be spent on actual delivery work.
Why does manual reporting stop working around five to eight clients?
Because the time cost scales linearly with client count while your available hours don’t. Pulling data by hand from Search Console, GA4, and a rank tracker, then formatting it into a deck or document, commonly takes five to ten hours per client per month when done manually, according to a widely cited 2026 agency benchmark. Multiply that by even eight accounts and reporting alone is eating a full working week, time that produces zero new rankings, zero new content, zero actual client results. The same benchmark found that agencies who automate the data-pulling layer cut that down to roughly twenty minutes of strategist review per client, which is the actual gap between an agency that can scale past ten accounts and one that can’t.
How do you actually build the system, step by step?
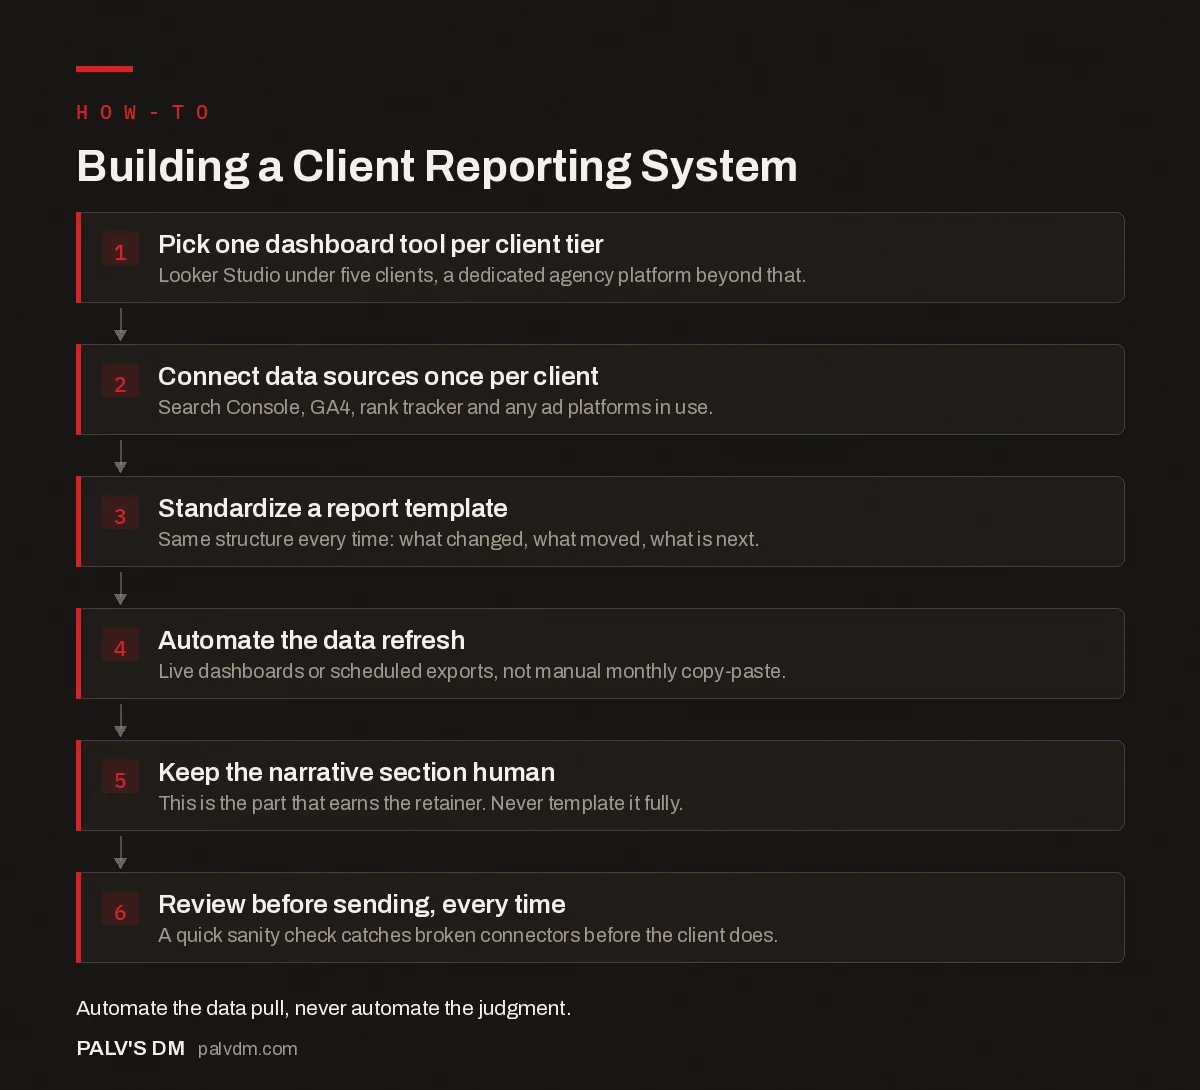
Building a Client Reporting System
- Pick one dashboard tool per client tier. Looker Studio under five clients, a dedicated agency platform beyond that.
- Connect data sources once per client. Search Console, GA4, rank tracker and any ad platforms in use.
- Standardize a report template. Same structure every time: what changed, what moved, what is next.
- Automate the data refresh. Live dashboards or scheduled exports, not manual monthly copy-paste.
- Keep the narrative section human. This is the part that earns the retainer. Never template it fully.
- Review before sending, every time. A quick sanity check catches broken connectors before the client does.
Which reporting tool should you actually use?
It depends mostly on client count, and being honest about where you actually are matters more than picking the “best” tool in the abstract.
- Looker Studio, for one to five clients. Free, unlimited dashboards, and native integration with Google Analytics, Search Console and Google Ads. The setup work is manual (building each connector, each chart) but the ongoing cost is zero. It starts to strain once you need consistent white-labeling, client login portals or automated alerting across many accounts at once.
- A dedicated agency platform, past five to eight clients. Tools like AgencyAnalytics are purpose-built around agency workflows: white-labeled dashboards, dozens of pre-built integrations, automated report scheduling, and client access management out of the box. It costs real money per month, but it’s buying back the hours a manual Looker Studio setup would otherwise demand at that scale.
- A hybrid, which is what we actually run. Looker Studio for a couple of long-standing clients whose dashboards are already built and stable, a dedicated platform for the rest. Rebuilding a working dashboard just to standardize tooling rarely justifies the time it costs.
What should actually be in the report itself?
Numbers alone don’t hold a client’s attention past the second month. The reports that actually get read every time have a consistent structure: what changed this month (specific actions taken, not vague activity), what moved as a result (traffic, rankings, conversions, tied back to those actions where you can honestly draw the line), and what’s planned next. That narrative section is the one part of the process we never automate or templatize beyond a skeleton structure. A client can tell within a couple of reports whether someone actually looked at their account or whether a tool spat out the same paragraph with different numbers swapped in.
The default WordPress-adjacent instinct (pull everything the dashboard tool can show, present all of it) usually backfires. A twelve-page PDF with forty metrics gets skimmed once. A one-page summary with three to five numbers that matter and a short written take gets actually read, every month.
What should stay out of the automated layer entirely?
Anything that requires judgment. Automating the data pull is safe: numbers are numbers, and a well-built dashboard pulls them accurately every time without a human retyping figures into a template. What shouldn’t get automated is the interpretation: why a metric moved, whether that’s good or bad in context, and what it means for next month’s priorities. We’ve seen agencies try to template even that part with fill-in-the-blank language (“Organic traffic {increased/decreased} by {X}% this month”), and clients notice. It reads exactly as generated as it is.
How do you handle a bad month in an automated system?
This is where the human layer earns its place. An automated dashboard will show a traffic drop the same way it shows a traffic gain, flatly, as a number. What the client needs in that moment is context a template can’t provide: was this a seasonal dip, an algorithm update, a technical issue that’s already been fixed, or something that genuinely needs a strategy change. Skipping that explanation, or worse, quietly hoping the client doesn’t check the dashboard that month, is how agencies lose accounts. Address a down month directly in the narrative section before the client has to ask about it.
What happens when two tools disagree on the numbers?
This comes up constantly and it’s worth deciding your policy on before a client asks. Search Console, GA4 and a third-party rank tracker will rarely agree exactly on the same metric, since each measures slightly differently: sampling methods, tracked search engines, bot filtering, and update frequency all vary. Pick one source of truth per metric and say so explicitly in the report itself, something as simple as “rankings shown here are tracked via [tool], your position may vary slightly across other trackers.” That one sentence heads off a confusing conversation later, when a client checks their own SEMrush account and sees a different number than the one in your report and assumes something’s wrong.
Never quietly switch which tool you’re pulling from between reports without flagging it. A rankings graph that jumps because you changed data sources, not because rankings actually moved, looks exactly like a mistake even when it isn’t one.
Does report cadence need to differ by client type?
Yes, and treating every retainer identically is a common early-agency mistake. A long-running retainer client who trusts the relationship often prefers a lighter monthly touch with a live dashboard they can check anytime. A newer client, or one on a short-term project with a defined end date, usually wants more frequent, more detailed check-ins until trust is established. We adjust cadence by relationship stage rather than running one fixed schedule for every account: heavier reporting in the first two or three months of any new engagement, settling into a lighter monthly rhythm once the client has seen enough consistent results to relax.
Frequently asked questions
How often should you send SEO reports to clients?
Monthly is standard for most retainer relationships, with a live dashboard available in between for clients who want to check more often. Weekly written reports are rarely worth the effort since SEO moves too slowly for weekly numbers to mean much; a live dashboard covers that need better than a repeated email.
What should be included in an SEO client report?
Traffic and ranking trends, yes, but the section that actually matters is what changed and why: what was done that month, what moved as a result, and what’s planned next. A report that’s only a screenshot of numbers with no narrative gets skimmed once and ignored after that.
What’s the best free tool for SEO reporting?
Looker Studio is the strongest free option, with unlimited dashboards and native integration with Google Analytics, Search Console and Google Ads. It struggles once you’re managing many clients at once, since it lacks built-in white-labeling, client portals and automated alerts that dedicated agency platforms provide.
How do you automate SEO client reporting?
Connect each client’s data sources to a dashboard tool once, set a recurring export or live-refresh schedule, and reserve human time for the narrative section, not the number-pulling. Purpose-built platforms like AgencyAnalytics automate the data layer entirely; a Looker Studio setup needs more manual connector work upfront to get there.
Should SEO reports show rankings or business outcomes?
Both, but lead with outcomes. Rankings and traffic are useful supporting detail; what a client actually wants to know is whether the work is producing leads, calls or revenue. A report built around ranking positions alone reads as busywork to a client who cares about their bottom line.
Sources
- Best SEO Reporting Tools for Agencies, AgencyAnalytics
- Looker Studio, Google
- What an SEO Agency Should Report Every Month
- Documenting SOPs So Delivery Doesn’t Depend on One Person
- Project Management for SEO Teams
- Automating Reports With Google Sheets and Apps Script
Want this done on your site?
Every PalV’s DM engagement starts with a free audit of your actual website — a 12-point
crawl covering what is blocking indexation, on-page gaps against your primary keywords, speed
findings, and the three to five fixes worth making first. Delivered in two working days. No
payment details, and the findings are yours whether you hire us or not.
Get your free SEO audit
See One-Time Service plans and prices