Trends & Industry Developments
CTR Benchmarks Are Being Rewritten: The Current Numbers
Organic CTR 2026 benchmarks have fragmented by query type. See why old CTR-by-position tables are unreliable and how to build your own baseline instead.
Organic CTR in 2026 no longer follows the position-based curves most SEOs grew up on. Position one still pulls the largest click share on most queries, but the gap between position one and the positions below it has narrowed on informational searches, because AI Overviews, AI Mode, and other answer panels now sit above the blue links and absorb a chunk of the click before a searcher scrolls to the organic results. The old benchmark tables — a single average CTR per position — were built for a results page that increasingly doesn’t exist. That doesn’t mean CTR stopped mattering. It means the number you should compare yourself against is your own historical baseline, segmented by query type, not a static industry chart.
Key takeaway
- Published organic CTR benchmark tables predate the current SERP and are unreliable as a fixed target — treat them as a rough compass, not a scoreboard.
- The clicks moving are concentrated on informational, top-of-funnel queries where an AI Overview or AI Mode panel can answer the question directly; transactional and branded queries are far more stable.
- The useful benchmark now is your own Search Console history, segmented by query intent and by whether an AI surface appears on the query, re-checked every quarter.
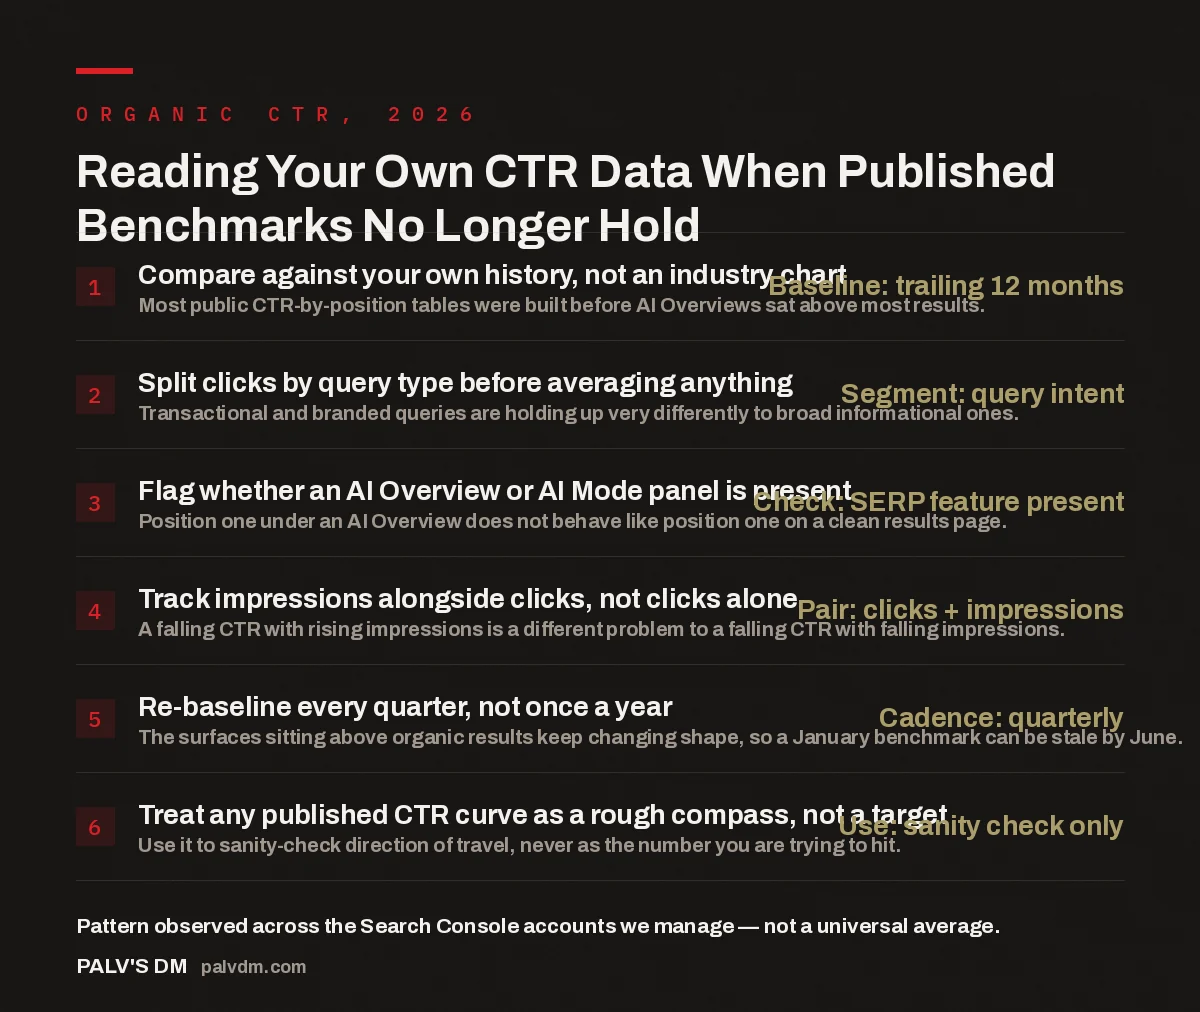
Reading Your Own CTR Data When Published Benchmarks No Longer Hold
- Compare against your own history, not an industry chart — Baseline: trailing 12 months. Most public CTR-by-position tables were built before AI Overviews sat above most results.
- Split clicks by query type before averaging anything — Segment: query intent. Transactional and branded queries are holding up very differently to broad informational ones.
- Flag whether an AI Overview or AI Mode panel is present — Check: SERP feature present. Position one under an AI Overview does not behave like position one on a clean results page.
- Track impressions alongside clicks, not clicks alone — Pair: clicks + impressions. A falling CTR with rising impressions is a different problem to a falling CTR with falling impressions.
- Re-baseline every quarter, not once a year — Cadence: quarterly. The surfaces sitting above organic results keep changing shape, so a January benchmark can be stale by June.
- Treat any published CTR curve as a rough compass, not a target — Use: sanity check only. Use it to sanity-check direction of travel, never as the number you are trying to hit.
Why did the old CTR curves stop working?
The CTR-by-position benchmark tables that circulated for years assumed a fairly consistent results page: ten blue links, maybe a featured snippet, maybe a local pack, and a predictable drop-off in clicks as you moved down the page. That assumption is what’s broken. On a growing share of informational queries, an AI Overview or an AI Mode-style answer panel now occupies the space directly under the search box, ahead of every organic result. The searcher’s question can be answered, at least partially, before they ever reach position one. When that happens, the click that used to go to the top organic result either doesn’t happen at all, or it happens further down the page, to whichever result the searcher trusts enough to verify the answer.
Two accounts with identical position-one rankings can now show meaningfully different CTR — one ranks for queries that still return a clean, link-first page, the other for queries where an AI panel sits above it. Averaging both into a single “position one CTR” figure, the way old benchmark tables did, hides more than it reveals.
What’s actually pulling clicks away from organic results?
In the accounts we work on, the pattern is consistent even though the exact magnitude varies query by query: the queries losing organic click share sit at the top of the funnel — definitional questions, “how does X work” searches, comparisons that can be summarised in a paragraph. These are precisely the query types an AI Overview is built to answer directly on the page. Queries with clear commercial or navigational intent — “book a flight to Mumbai,” “[brand] pricing,” a company name search — are far less affected, because there’s nothing an answer panel can substitute for the action the searcher actually wants to take.
That split matters more than any single average CTR figure, because it tells you where to focus. If most of your organic traffic sits in informational, top-of-funnel content, you should expect your CTR trend line to look different — and probably softer — than an account built mostly around transactional pages. Neither is wrong. They’re just not comparable against the same benchmark.
How should you actually benchmark organic CTR in 2026?
Since the industry-wide organic CTR 2026 tables are averaging across a results page that no longer looks the same query to query, the only benchmark that holds up is the one you build from your own data. That means three things in practice. First, pull your own Search Console CTR by position, but segment it by query intent rather than looking at one blended curve — informational, commercial, transactional, and branded queries each deserve their own trend line. Second, wherever you can identify it, flag which queries currently trigger an AI Overview or AI Mode panel, because that single variable explains more of the CTR variance than position does on its own. Third, set your comparison window to your own trailing months, not a benchmark published a year or two ago — the SERP layout for a given query type can shift within a single quarter as these AI surfaces roll out further.
This is slower than pasting a benchmark table into a slide. But it’s the version of the number that’s actually true for your site, which is the only version worth acting on.
The industry kept publishing CTR-by-position charts long after the page those charts described had already changed. The fix isn’t a better chart — it’s accepting that your own Search Console data, segmented properly, is the only benchmark that was ever going to be honest.
Palash, Founder, PalV’s DM
Does a falling CTR always mean something is wrong?
No, and this is the part teams tend to get wrong when they see a CTR dip and immediately treat it as a ranking or content problem. Look at impressions alongside CTR before drawing a conclusion. If impressions are climbing while CTR softens on a set of informational queries, that’s usually a sign an AI surface has started appearing on those queries — you’re still being shown, you’re just being shown alongside an answer panel that’s absorbing some of the clicks. That’s a visibility question, not a content-quality question, and the fix is different: it’s about earning a citation inside that AI panel, not rewriting your title tag. If impressions are falling too, that’s a different and more serious signal — you may actually be losing visibility, which is a ranking or indexing issue and needs to be diagnosed as one.
Conflating a citation problem with a ranking problem is the most common mistake we see when teams explain a CTR drop using only the old position-based playbook.
What should you do differently now?
- Rebuild your CTR reporting around query-intent segments instead of a single blended average, so a soft month in informational content doesn’t get mistaken for a site-wide problem.
- Pull impressions into the same view as clicks, every time, so you can tell a visibility shift apart from an engagement shift before you act on either.
- Track which of your queries currently surface an AI Overview or AI Mode panel, and revisit that list quarterly — it changes.
- For the informational queries most exposed to AI answer panels, start measuring whether you’re being cited inside the panel, not just whether you’re ranking below it — that’s a separate, and increasingly more important, form of visibility.
- Stop importing a published industry CTR average as a target. Use it, at most, to sanity-check direction — is the account trending the way the broader pattern would suggest — never as the number the team is graded against.
None of this is a reason to deprioritise organic search. It’s a reason to widen what “organic visibility” is measured against — the click is still the outcome that pays the bills, but it’s no longer the only signal that tells you whether the work is landing.
Where this goes next
If your CTR reporting is still one blended curve and you can’t say which queries are showing an AI Overview, that’s the gap to close first. We build multi-surface visibility measurement — clicks, impressions, and AI citation tracking — as part of our AI visibility work.
FAQ: Organic CTR in 2026
Are published organic CTR benchmark tables still useful at all?
Only as a rough sanity check, not a target. They were built by averaging across results pages that varied far less than today’s, before AI Overviews and AI Mode became common on informational queries. Use them to check direction of travel, and rely on your own segmented Search Console history for anything you’re actually going to act on.
Why is my position-one CTR lower than it used to be even though rankings haven’t changed?
Check whether the query now shows an AI Overview or AI Mode panel above the organic results. If it does, some of the searchers who used to click through to your page are getting their answer directly on the results page instead. Pair that CTR figure with your impressions trend to confirm whether this is a click-behaviour shift rather than a ranking drop.
Should I segment CTR reporting by query intent or by page type?
Query intent first. Two pages of the same type can behave very differently depending on whether the queries they rank for are informational or transactional, since AI answer panels concentrate on informational queries. Segmenting by page type alone can average those two behaviours together and hide the real pattern.
How often should I re-baseline my own CTR benchmarks?
Quarterly, at minimum, for accounts with meaningful informational traffic. The surfaces sitting above organic results keep expanding to new query types, so a baseline set in one quarter can already be out of date by the next. Transactional and branded query segments move more slowly and can be reviewed less often.
Does a lower organic CTR mean I should stop investing in SEO?
No. It means the definition of visibility needs to expand alongside it. Organic clicks are still valuable, but on the queries most exposed to AI answer panels, being cited inside that panel is becoming a second, parallel form of visibility worth measuring and earning on its own terms, not a replacement for ranking well.
Related reading
- For the click-share picture at the other end of the funnel, see Zero-Click Search Data: How Much Traffic Really Disappeared.
- To understand which query types are most likely to trigger the answer panels discussed above, see How Often AI Overviews Appear, by Query Type.
- Ranking well and being cited are increasingly separate problems — see The Collapsing Overlap Between Ranking #1 and Being Cited.
- For the wider context behind all of these shifts, see our pillar post The State of Search in 2026: What Actually Changed.
Short version: organic CTR in 2026 hasn’t collapsed uniformly — it has fragmented by query type. Informational queries are the ones absorbing the impact of AI Overviews and AI Mode, while transactional and branded queries have stayed comparatively stable. The published CTR-by-position benchmark tables were built for a results page that no longer exists in the same form, so they’re only useful as a loose sanity check now. The number worth building your reporting around is your own historical CTR, segmented by query intent, cross-checked against impressions, and re-baselined every quarter — paired with a growing second measure, AI citation visibility, for the queries where the click itself is no longer the only signal that matters.