PageSpeed Insights API for Bulk Speed Auditing
How to bulk audit page speed with the PageSpeed Insights API: setup, quota limits, the CrUX data change most tutorials miss, and the scripting mistake to avoid.

Bulk auditing with the PageSpeed Insights API means looping a script over your URL list, calling the same runPagespeed endpoint you’d hit manually, and logging the results instead of reading them one page at a time in a browser tab. No special bulk endpoint exists. It’s the same API, called repeatedly, with enough spacing between requests to stay inside Google’s quota.
Most teams either avoid this entirely and click through PageSpeed Insights one URL at a time, which doesn’t scale past about ten pages, or they pay for a third-party tool that’s really just wrapping the same free API with a nicer dashboard. For a site with fifty to a few thousand URLs, a basic script against the official API gets you the same data for the cost of an afternoon’s setup.
Why bother scripting this instead of just using the PageSpeed Insights website?
Because the website version doesn’t scale, and it doesn’t remember anything. Testing fifty pages by hand means fifty browser tabs, fifty copy-paste jobs into a spreadsheet, and no record of what the score was last month to compare against. A script turns the same task into something that runs unattended, logs consistently, and can be scheduled to repeat, which is the difference between a one-time audit and an actual monitoring habit.
It’s also just faster once it’s built. A well-paced script can work through a few hundred URLs, both strategies, well within an hour, running overnight while nobody’s watching. The setup cost is real, maybe half a day the first time, but it pays for itself the second time you need to check the same site.
What do you need before you start?
Three things: a Google account, a list of URLs to test, and comfort running a short script (Python or Node both work fine; the examples here assume Python since it’s the more common starting point for SEO scripting). You don’t strictly need an API key for occasional single lookups, but for anything you’d call “bulk,” get one. Unauthenticated requests share a much smaller, unpublished quota pool, and a key costs nothing to create.
How do you actually run a bulk audit, step by step?
Here’s the sequence, in the order it actually needs to happen.
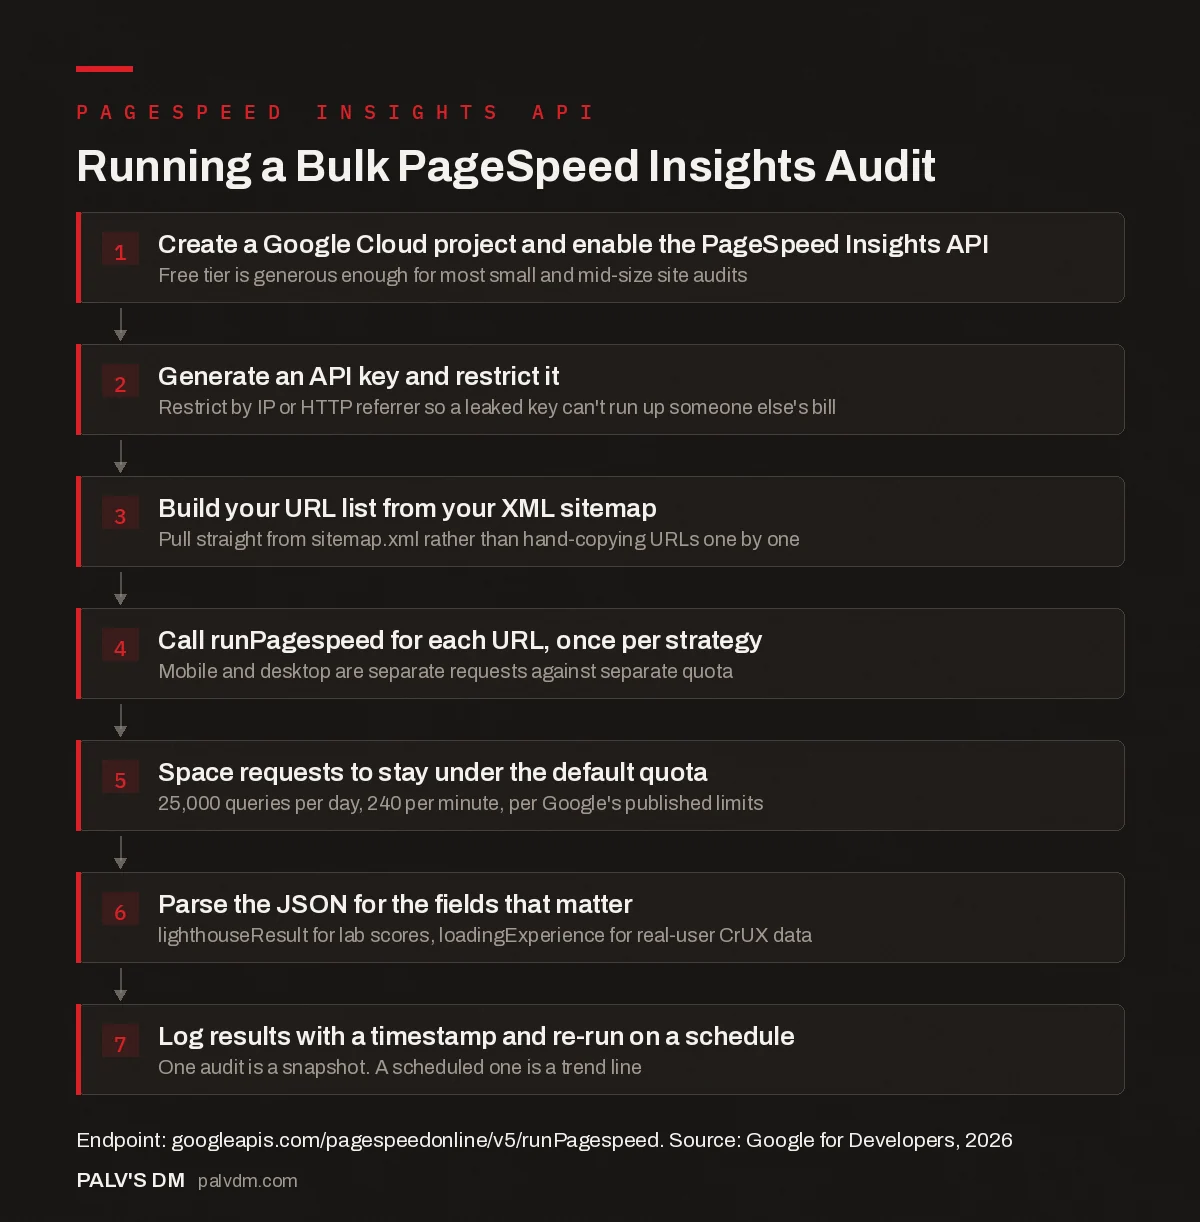
Running a Bulk PageSpeed Insights Audit
- Create a Google Cloud project and enable the PageSpeed Insights API. Free tier is generous enough for most small and mid-size site audits.
- Generate an API key and restrict it. Restrict by IP or HTTP referrer so a leaked key can’t run up someone else’s bill.
- Build your URL list from your XML sitemap. Pull straight from sitemap.xml rather than hand-copying URLs one by one.
- Call runPagespeed for each URL, once per strategy. Mobile and desktop are separate requests against separate quota.
- Space requests to stay under the default quota. 25,000 queries per day, 240 per minute, per Google’s published limits.
- Parse the JSON for the fields that matter. lighthouseResult for lab scores, loadingExperience for real-user CrUX data.
- Log results with a timestamp and re-run on a schedule. One audit is a snapshot. A scheduled one is a trend line.
The core request looks like this once you have a key:
curl "https://www.googleapis.com/pagespeedonline/v5/runPagespeed?url=https://example.com/&strategy=mobile&key=YOUR_API_KEY"Swap strategy=mobile for strategy=desktop to get the other view. They’re genuinely separate requests against separate quota, not two outputs from one call, which is the detail that trips up a lot of first attempts at estimating how many total calls a full audit will use.
What’s the one thing most bulk-audit tutorials get wrong?
They treat the API’s field data as permanent. Google’s own documentation now states plainly that real-world Chrome User Experience Report (CrUX) data is being phased out of the PageSpeed Insights API, with Google pointing developers toward the dedicated CrUX API and CrUX History API instead for that specific dataset going forward. A lot of existing tutorials and scripts, including some still being published, pull loadingExperience and originLoadingExperience out of the PSI response as if that’s the stable, long-term way to get field data. It’s worth knowing that’s changing, and building anything meant to keep working long-term against the CrUX API directly rather than the CrUX fields bundled inside a PageSpeed Insights response.
The Lighthouse lab data, under lighthouseResult in the response, isn’t affected by that change and remains the core of what PSI returns: performance, accessibility, best-practices and SEO scores, plus the specific audits behind each one.
How do you manage the quota across hundreds of URLs?
Google’s published default limits sit at 25,000 queries per day and 240 queries per minute per project, which sounds like a lot until you remember mobile and desktop count as separate queries, and a full site audit run twice a day for trend tracking adds up faster than it looks at first glance. A few hundred URLs, tested on both strategies, comfortably fits inside a single day’s quota with room to spare. A few thousand URLs, especially if you’re running full category and mobile-plus-desktop coverage daily, needs actual planning.
The practical approach: run a full, both-strategy sweep of your entire URL list once a day, ideally overnight or during low-traffic hours so you’re not adding load to a period that matters for real users. Then run a lighter check, mobile-only, on just your handful of highest-priority pages more frequently if you want tighter tracking on the pages that matter most. That balances coverage against quota instead of blowing through the daily limit on page fifteen of a two-thousand-URL sitemap.
What do you do with the results once you have them?
Log them somewhere queryable, not just a folder of JSON files nobody opens again. A spreadsheet with one row per URL per run date, pulling out the handful of fields you actually act on (performance score, LCP, INP, CLS, and the top two or three opportunities from the audits list) turns a one-off scrape into a trend line you can actually use in a client report. That’s also where a scheduled run earns its setup cost: a single audit tells you where a site stands today. A weekly or daily one tells you whether last month’s fixes actually held, or quietly regressed after a plugin update nobody flagged.
What’s the single biggest mistake we see in DIY bulk PageSpeed scripts?
Not checking the response status before writing results. The most common failure pattern: someone loops through two hundred URLs firing requests as fast as the API accepts them, hits a rate limit or an individual page timeout thirty minutes in, and never notices that a chunk of URLs silently failed because the script logged whatever came back, error or not, without checking it first. The spreadsheet ends up with blank rows or malformed data mixed in with real scores, and whoever reads the report later has no way to tell which numbers are real. Build in a status check, retry logic with a short delay for failed calls, and a simple log of which URLs actually succeeded. It’s maybe ten extra lines of code and it’s the difference between a report you can trust and one you have to double-check by hand anyway.
How does this fit alongside Search Console’s Core Web Vitals report?
They answer different questions and both are worth having. Search Console’s Core Web Vitals report groups URLs by similarity and shows you field data (real Chrome users) at the property level, which is great for spotting a pattern, like “every product page on this site has a poor LCP,” without you having to test each one individually. What it doesn’t give you is a per-URL, on-demand snapshot you can trigger whenever you want, or the specific Lighthouse audit list explaining exactly what’s slow and why.
A bulk PageSpeed Insights script fills that gap. Use Search Console to find the pattern across the whole property, then run a targeted bulk audit against the specific URL group the pattern points to, to get the granular, per-page detail you’d need to actually brief a developer. Neither tool replaces the other; they’re the difference between “here’s the shape of the problem” and “here’s the exact fix for this specific template.”
Frequently asked questions
Is the PageSpeed Insights API free to use?
Yes, there’s no charge from Google for the API itself, only the usage quota to manage: 25,000 queries per day by default, per project, with the option to request a higher limit through Google Cloud if a larger site genuinely needs it.
What’s the difference between the PageSpeed Insights API and Lighthouse CLI?
Lighthouse CLI runs entirely on your own machine and gives you full control over the environment (device emulation, throttling settings, custom configs). The PageSpeed Insights API runs Lighthouse on Google’s infrastructure and also layers in real-world CrUX field data (for now) alongside the lab results, which the CLI alone doesn’t provide.
Can I run a bulk audit without writing code?
Yes, with limitations. Google Sheets add-ons and no-code automation tools (like a scheduled Apps Script pulling the API, or third-party bulk-checker tools) can hit the same endpoint without you writing a script from scratch, though you’ll have less control over pacing, error handling, and exactly which fields get logged.
Why does field data (CrUX) sometimes say “no data available”?
CrUX only reports on URLs and origins with enough real Chrome user traffic to meet Google’s privacy and statistical thresholds. Low-traffic pages, brand-new sites, or very specific deep URLs often won’t have enough real-user data yet, even though the same page returns a perfectly normal Lighthouse lab score.
How often should I re-run a bulk speed audit?
Daily for your highest-priority pages if you’re actively working on performance, weekly or monthly for a full-site sweep once things have stabilized. The right cadence depends on how often the site actually changes: a site with frequent plugin updates or content pushes needs more frequent checks than a static brochure site that rarely changes.
Sources
- Get Started with the PageSpeed Insights API, Google for Developers
- Chrome UX Report (CrUX) API, Chrome Developers
- Core Web Vitals: LCP, INP and CLS Explained Properly
- Python for SEO: Five Scripts Worth Writing First
- Using the Search Console API for Bulk Query Data
- Automating Reports With Google Sheets and Apps Script
Want this done on your site?
Every PalV’s DM engagement starts with a free audit of your actual website — a 12-point
crawl covering what is blocking indexation, on-page gaps against your primary keywords, speed
findings, and the three to five fixes worth making first. Delivered in two working days. No
payment details, and the findings are yours whether you hire us or not.