How to Add Original Data to a Post Without a Research Team
No research team, no problem. Four practical ways to add real original data to a blog post: analytics, audits, small surveys, and first-hand tests.

You don’t need a research team to add original data to a post — you need one of four sources most teams already have access to: your own analytics, a small reader or customer survey, public datasets synthesised into a new table, or a documented first-hand test. Each one produces a number nobody else has cited exactly that way, which is the whole point. The goal isn’t a peer-reviewed study. It’s one checkable fact that separates your page from the nine others saying the same generic thing.
Published August 2026 — SEO team at PalV’s DM.
What actually counts as “original data” in a blog post?
Anything you measured, collected, or observed yourself, presented with enough detail that a reader could in principle verify it. That includes your own Google Search Console numbers, a poll you ran on your newsletter, a manual audit of 20 competitor pages, or a before/after screenshot from a project you actually did. It does not include restating someone else’s statistic in your own words — that’s still their data, just paraphrased. The distinction matters because AI-powered search tools and human readers both treat “X% of businesses do Y” (unsourced, copied from a dozen other blogs) very differently from “we checked 40 client accounts and found Y” (specific, attributable, harder to fake).
Where do you get original data without a research budget?
Four sources cover most situations, ranked from least to most effort:
| Source | What it gives you | Time needed |
|---|---|---|
| Your own analytics (GA4, GSC, CRM, POS) | Real numbers about your own audience or business, safe to publish if anonymised | 30-60 minutes to pull and check |
| A manual audit of a public sample | A synthesis nobody else built, e.g. “we checked the top 20 results for X and found Y” | 1-3 hours depending on sample size |
| A small survey (10-50 responses) | Opinion or behaviour data with a real, stated sample size | A few days to collect responses |
| A documented first-hand test | Before/after proof of something you actually did, with screenshots | Depends on the test; often already done for client work |
How do you pull usable data from your own analytics?
Start with a specific question, not a data dump. “What percentage of our organic blog traffic comes from mobile” is answerable in Google Analytics in under ten minutes and is a legitimate original stat if you state the time period and site. Vague requests like “find something interesting in our data” waste time and usually produce nothing citable.
- Pick a metric relevant to the post’s topic, not just whatever’s easiest to pull. A post about page speed should cite your own Core Web Vitals numbers, not your bounce rate.
- State your sample size and date range every time. “43 client sites, Jan-Jun 2026” is credible. “Our data shows” with no scope is not, and reads as unverifiable to both readers and AI systems trying to attribute the claim.
- Anonymise before publishing. Aggregate numbers or ranges are almost always fine; naming specific clients without consent is not.
- Screenshot the source dashboard if you’re comfortable sharing it, even blurred. It adds a layer of proof that plain text doesn’t.
How small can a survey be and still count as original data?
Smaller than most people assume, as long as you’re honest about the sample size. A 25-response survey of your own email list is legitimate original data if you write “we surveyed 25 subscribers in July 2026” rather than implying it’s representative of a whole industry. The credibility problem isn’t sample size — it’s overstating what a small sample proves. Free tools like Google Forms or a Typeform survey embedded in a newsletter can get you 20-50 responses in a week from an engaged list, which is enough for one or two genuinely new data points in a post.
If you don’t have an audience to survey yet, a manual audit of public information is usually faster and needs zero recruitment. Reviewing 30 competitor pricing pages and tabulating what’s included at each tier is original data — you built that table, nobody else published it in that exact form, and it’s fully checkable by anyone who wants to verify it.
What’s the fastest original data point for a team with no time?
A manual audit of something public. Pick 15-30 examples relevant to your post — competitor pages, public case studies, tool feature lists, pricing tiers — and tabulate one specific thing about each. This takes an afternoon, requires no permission from anyone, and produces a table that didn’t exist before you built it. It’s the lowest-effort route to a genuine information gain over pages that just describe the topic in general terms.
- Define exactly what you’re checking (one variable, not five).
- Pick a defensible sample — “top 20 results for [keyword]” or “the 15 largest players in [category].”
- Record the date you checked, since this kind of data goes stale.
- Build the table directly in the post, not just in a spreadsheet nobody sees.
- State the method in one sentence so readers can judge how much weight to give it.
How do you present data so AI engines and readers can actually use it?
Put the number in plain text near the top of the relevant section, not buried only inside a chart image. AI Overviews, Perplexity, and similar tools pull from text they can parse; a beautiful bar chart with no text equivalent is invisible to them. Adding statistics to content has been linked to meaningfully higher visibility in AI-powered search results, and the mechanism is straightforward — specific, sourced numbers are exactly what these systems extract to build their answers. Pair any chart or infographic with a short text or table version of the same data directly underneath it, which is standard practice for content aimed at both classic search and AI citation.
Where does this fit with a content calendar that has no research budget line item?
Most teams don’t need a new budget line, they need to stop treating “look in our own data” as a separate project. If you’re publishing regularly and never once pull a real number from your own systems, that’s a process gap, not a resourcing gap. Our content writing service builds a data check into the brief for every post where it’s relevant — five minutes of “what do we actually know here” before drafting starts, which is usually enough to find one usable stat.
What’s a realistic first project if your team has never done this before?
Pick one post already scheduled for this month and add exactly one original stat to it before publishing, rather than trying to overhaul the whole calendar at once. Choose a topic where you almost certainly have relevant internal data — page speed, conversion rate, email open rate, whatever your team already tracks — and pull one specific, dated number. Publish it, note whether it changed how the post performed, and use that as the template for the next post.
This incremental approach beats a big “data strategy” initiative that never gets off the ground because it’s scoped too large. One good stat in one post, repeated consistently across a calendar, adds up to a meaningfully more original content library within a few months, without ever requiring a dedicated research budget or a new hire.
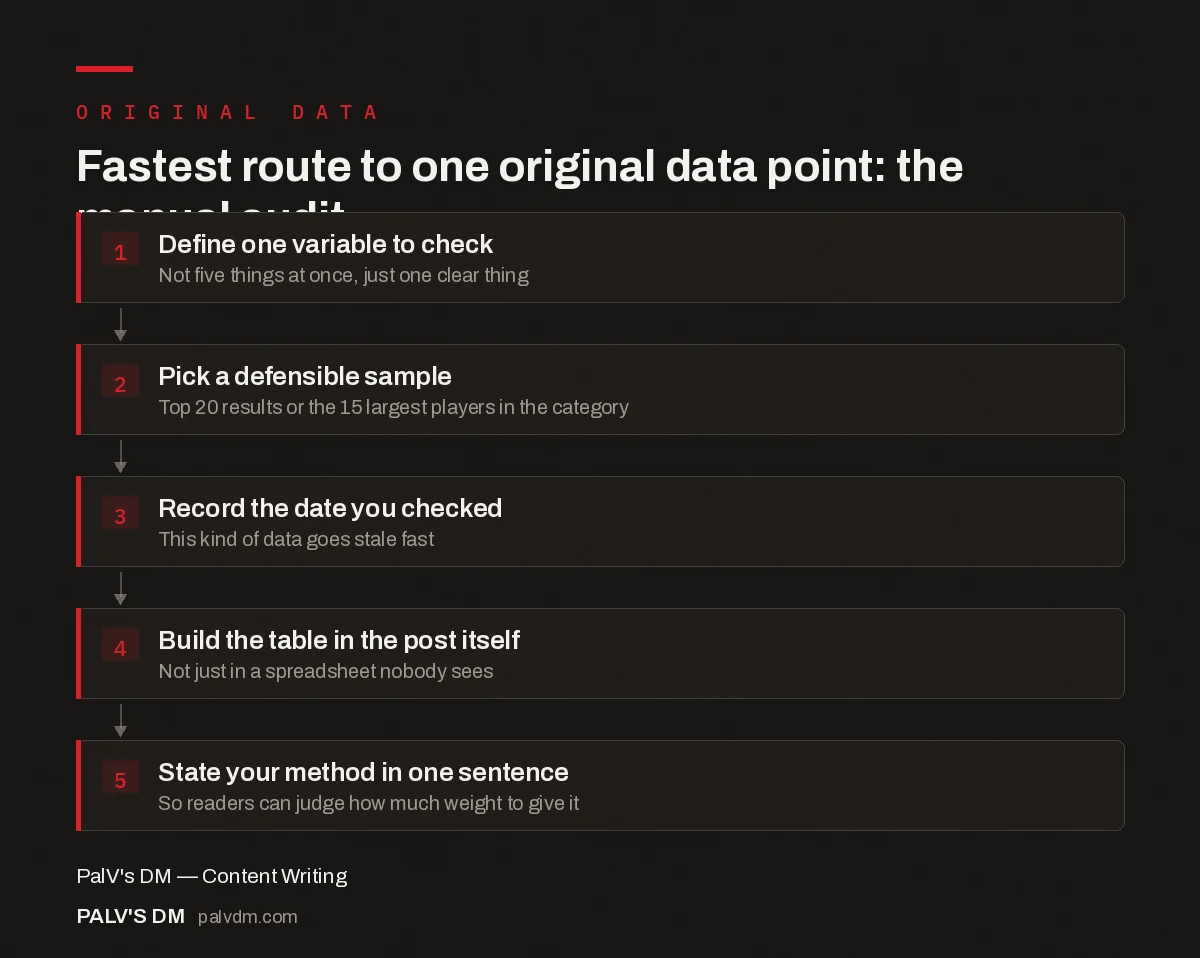
Fastest route to one original data point: the manual audit
- Define one variable to check. Not five things at once, just one clear thing.
- Pick a defensible sample. Top 20 results or the 15 largest players in the category.
- Record the date you checked. This kind of data goes stale fast.
- Build the table in the post itself. Not just in a spreadsheet nobody sees.
- State your method in one sentence. So readers can judge how much weight to give it.
Related reading on original content and information gain
This post is part of our content strategy guide cluster on building genuinely original posts. If you haven’t yet nailed down why original data matters for ranking, start with information gain: saying something the top 10 didn’t. For data you can’t pull from your own systems, interviewing an expert for a 20-minute quote is the next-fastest source of something genuinely new. And if you’re weighing how much of the writing itself to hand to AI tools once you have the data, see where AI writing tools help and where they wreck quality. For the sourcing discipline behind any number you publish, how to choose statistics for content is a useful companion piece.
FAQ
Do I need a statistician to run a survey for content?
No. A basic survey tool and an honest sample-size disclosure are enough for blog-level original data. You only need statistical rigour if you’re publishing the survey as a formal study or press release, not as supporting data inside a blog post.
Is data from a 10-person survey too small to publish?
It’s publishable if you’re transparent about it — “10 respondents from our client base” is honest framing. It becomes a problem only if you imply a small sample represents an entire market or industry.
Can I use public government or industry data as “original”?
Not as your own data, but you can create original value by synthesising it — combining two public datasets into one comparison table nobody else built is a legitimate information gain, as long as you cite the underlying sources.
How often does data-backed content need updating?
Whenever the underlying numbers change meaningfully, and at minimum reviewed annually. A stat that’s two years old with no refresh date reads as stale to both readers and search systems evaluating freshness.
What if our internal data shows something unflattering?
You can still use it if you frame it honestly, or pick a different metric. Don’t publish a cherry-picked number that misrepresents your own data just to make a stronger claim — that undermines the trust original data is supposed to build.