Attribution Models: Why SEO Always Looks Underpaid
Last-click attribution strips credit from organic search. Here is why, what data-driven attribution fixes, and how to report both fairly.

Published August 2026. Written by the SEO team at PalV’s DM.
SEO looks underpaid in most attribution reports because the default model, last-click, gives 100% of the conversion credit to whichever channel a customer used right before they bought. Organic search does most of its work earlier in the journey, so it keeps losing credit to the branded search, email click, or direct visit that happened to come last. The fix isn’t to distrust the data. It’s to use an attribution model built for multi-touch journeys and to report both models side by side.
Why does last-click attribution undercount organic search?
Last-click attribution assigns the entire conversion to the final touchpoint in the path, regardless of what happened before it. Picture a realistic B2B journey: someone finds a blog post via organic search in week one, forgets about the brand for three weeks, sees a retargeting ad, comes back through a branded Google search two weeks later, and converts. Last-click hands 100% of that revenue to “organic search (branded)” and gives zero credit to the non-branded search that started the whole thing.
This isn’t a bug in the reporting. It’s the model working exactly as designed. The problem is that the design assumes a single-touch journey, and most real purchases, especially considered B2B or high-ticket D2C purchases, involve five to seven touchpoints before a decision gets made.
What is multi-touch attribution and how does it fix this?
Multi-touch attribution assigns proportional credit to every touchpoint that influenced a conversion, rather than handing all the credit to one. Instead of the last search getting 100%, the model might assign 40% to the first organic visit that introduced the brand, 25% to a middle-funnel email click, and 35% to the final branded search that closed it. The exact split depends on the model.
Google Analytics 4’s default is data-driven attribution (DDA), which uses your account’s own historical conversion data to calculate how much each touchpoint actually contributed, rather than applying a fixed rule like “give 40% to the first touch and 60% to the last.” DDA requires enough conversion volume to compute a reliable model. Below a certain conversion threshold, GA4 falls back to a rule-based model, so very low-traffic sites may not get a true data-driven view yet.
How does the comparison actually look?
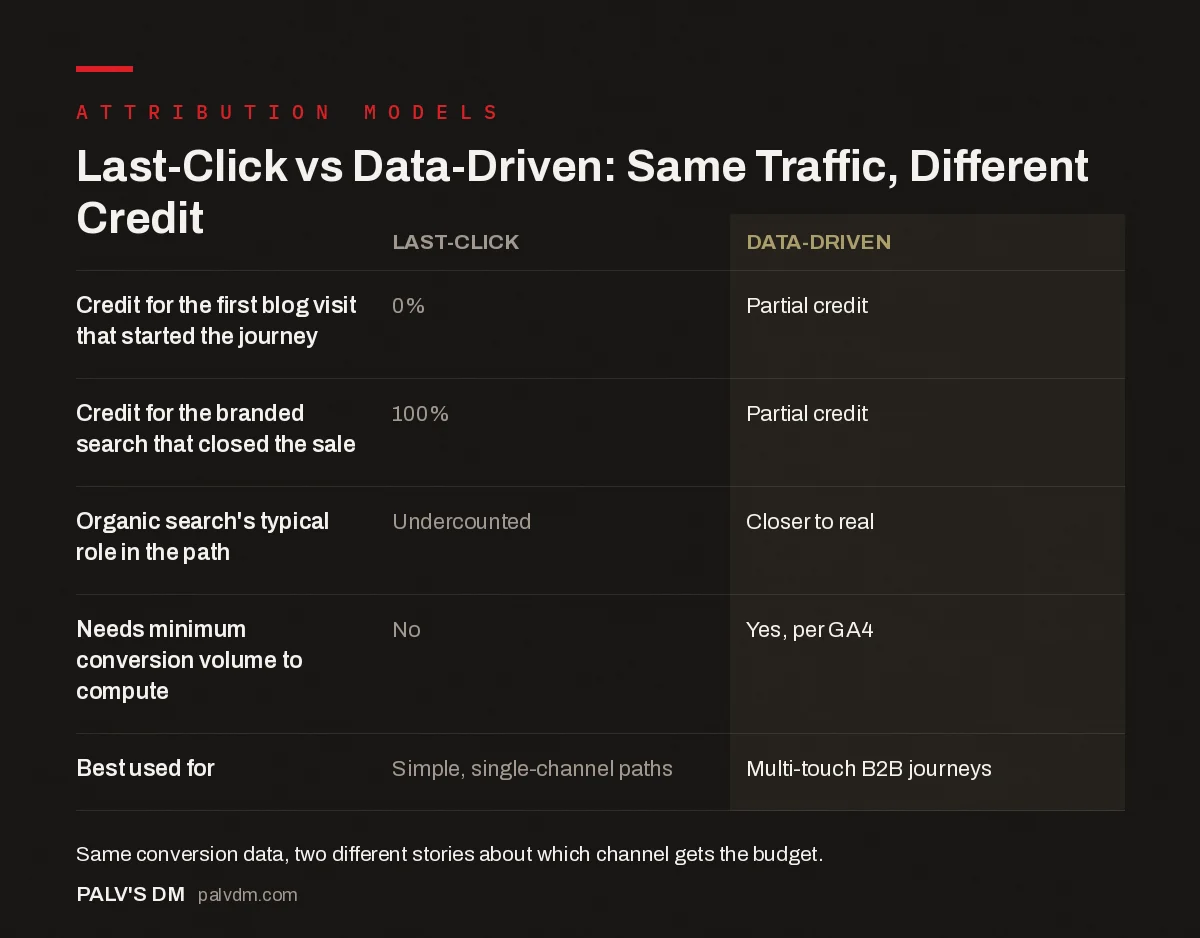
Last-click vs data-driven: same traffic, different credit
| Last-click | Data-driven | |
|---|---|---|
| Credit for the first blog visit that started the journey | 0% | Partial credit |
| Credit for the branded search that closed the sale | 100% | Partial credit |
| Organic search’s typical role in the path | Undercounted | Closer to real |
| Needs minimum conversion volume to compute | No | Yes, per GA4 |
| Best used for | Simple, single-channel paths | Multi-touch B2B journeys |
Same conversion data, two different stories about which channel deserves the next quarter’s budget. This is why a marketing team and a finance team looking at different attribution reports can genuinely disagree about whether SEO is working.
What other attribution models exist besides last-click and data-driven?
A few models sit between the two extremes, and each answers a slightly different business question:
- First-click gives all credit to the touchpoint that started the journey. Useful for measuring what drives initial awareness, but it ignores everything that happened to actually close the sale.
- Linear splits credit evenly across every touchpoint in the path. Simple to explain to a non-technical stakeholder, but it treats a passing glance at an ad the same as a 10-minute blog read.
- Position-based (U-shaped) gives 40% to the first touch, 40% to the last touch, and splits the remaining 20% across everything in between. A reasonable compromise when you want to credit both discovery and closing.
- Time-decay gives more credit to touchpoints closer to the conversion. Useful for short sales cycles, less useful for the long B2B cycles where SEO’s early influence matters most.
There’s no universally correct model. The right choice depends on how long your sales cycle runs and how many channels typically touch a single customer journey before they convert.
How do you set up attribution reporting that’s fair to SEO?
Three steps get most sites to a defensible reporting setup:
- Turn on GA4’s attribution comparison report. Under Advertising, GA4 lets you compare data-driven, last-click, and other rule-based models side by side for the same conversion data, without needing a separate tool.
- Report both models in the same document. Show last-click, because finance may already be used to it, alongside data-driven, because it’s the more accurate picture. The gap between the two numbers is itself useful information: a large gap means organic search is doing more upper-funnel work than the simple model shows.
- Extend the lookback window to match the real sales cycle. GA4’s default lookback window may be shorter than your actual buying cycle. A 90-day enterprise sales process needs a longer lookback window than the 30-day default, or early-funnel organic touches fall outside the model entirely.
What does this look like in a real cross-channel budget review?
Say a business runs three channels: paid search, email, and organic. Under last-click, the quarter’s conversion report might read: paid search 46%, email 31%, organic 23%. On those numbers, organic looks like the weakest performer, and it’s the first line item a finance team proposes cutting.
Run the same conversion data through data-driven attribution and the split often looks different: paid search 34%, email 24%, organic 42%. Nothing about the marketing activity changed between the two reports. What changed is which touchpoints got credit for starting journeys that a different channel happened to close. Paid search frequently over-indexes under last-click because retargeting ads, by design, show up right before a return visit and a purchase, capturing credit for demand that organic search generated weeks earlier.
This is precisely the scenario a CFO needs to see before agreeing to shift budget away from SEO. Presenting only the last-click number in that meeting isn’t dishonest, but it’s incomplete, and incomplete data drives real budget decisions in the wrong direction.
What mistakes make an attribution report unreliable?
A handful of setup errors show up often enough to be worth checking before trusting any attribution report, model choice aside:
- Cross-domain tracking gaps. If a checkout or booking process happens on a separate subdomain or a third-party payment page without cross-domain tracking configured, GA4 can lose the session and start a new one, breaking the multi-touch path and quietly handing credit to whatever channel appears in the new, truncated session.
- Referral exclusion list missing internal domains. Payment processors, live chat widgets, and internal tools that redirect users can show up as new referral sources mid-journey if they’re not added to GA4’s referral exclusion list, fragmenting a single visit into multiple sessions with different attributed channels.
- UTM inconsistency across campaigns. Email and social campaigns using inconsistent UTM naming, like “newsletter” in one send and “email_newsletter” in the next, split what should be one channel’s contribution across multiple rows in the report, understating its real impact.
- Conversion window mismatch. Comparing an attribution report using a 30-day lookback window against a sales cycle that regularly runs 90 days will systematically miss the early-funnel touches that happened outside the window, understating organic search specifically, since it tends to appear earliest in longer journeys.
None of these are attribution-model problems. They’re data-collection problems that make any model, last-click or data-driven, less trustworthy until they’re fixed. Audit the underlying tracking setup before assuming a disappointing organic number reflects real performance rather than a broken conversion path.
Frequently asked questions
Why does GA4 show different SEO numbers than last year?
GA4’s default attribution model is data-driven, while Universal Analytics defaulted to last-click for most standard reports. If your organic search numbers moved when you switched platforms, it’s very likely a model change, not a real change in performance. Check which model each platform used before comparing the two.
Can I use multi-touch attribution with a small amount of traffic?
Data-driven attribution needs a minimum volume of conversion data to compute a reliable model, and GA4 falls back to a rule-based approach below that threshold. Very low-traffic or low-conversion sites may need to rely on position-based or linear models until conversion volume grows enough for DDA to activate properly.
Should paid and organic search use the same attribution model?
Yes, for the comparison to be fair. Comparing organic search under a data-driven model against paid search under last-click will always make one channel look artificially stronger. Use the same model for every channel in a budget comparison, and if you must use two models, label both clearly in the report.
Does attribution model choice affect SEO ROI calculations?
Directly. An SEO ROI figure calculated under last-click will typically be lower than the same activity measured under data-driven attribution, because last-click strips credit from the early-funnel organic touches. If you’re building an ROI case for SEO budget, the attribution model you choose is one of the biggest levers on the final number, alongside the measurement window and cost inputs.
Which attribution model should a small business start with?
If conversion volume is low, start with position-based (U-shaped) attribution rather than jumping straight to data-driven. It’s easier to explain in a founder meeting, it credits both the discovery touchpoint and the closing touchpoint, and it doesn’t require the minimum data volume that GA4’s DDA model needs to compute reliably. Move to data-driven attribution once monthly conversions are consistently in the hundreds, which is roughly where DDA’s modelling becomes stable rather than noisy month to month.
The bottom line
SEO looks underpaid under last-click attribution because that model was built for simpler, shorter customer journeys than most businesses actually have. Switching to data-driven attribution, or at minimum reporting both models side by side, gives a more honest picture of what organic search is actually contributing, and makes the budget conversation a fairer one.
PalV’s DM’s SEO Growth service includes attribution reporting set up against your actual sales cycle, not a default 30-day window borrowed from a different business.
For the cost and revenue inputs this feeds into, see our guide to calculating SEO ROI. If you’re building a forward-looking case for budget rather than a backward-looking report, our SEO forecasting model post walks through that process. For page-level detail on where revenue is actually landing, see identifying which pages drive revenue. Our Google Search Console guide covers the underlying data source for all of this.