Benchmarking: What a Good CTR Looks Like by Position
What CTR should you expect by search position in 2026? Real benchmark data, why AI Overviews changed the numbers, and how to use them correctly.
Published August 2026 · SEO team at PalV’s DM
Click-through rate benchmarks by position have shifted noticeably in the last two years: multiple 2025-2026 studies, including Ahrefs’ analysis of roughly 300,000 keywords, found that AI Overviews correlate with a click-through rate reduction of around 58% for top-ranking organic pages when an AI Overview is present on the results page. Position 1 without an AI Overview or other heavy SERP feature still typically earns the highest share of clicks, but the exact percentage varies far more by query type, device, and SERP features present than older single-number benchmarks suggested. Treat any “CTR by position” chart as a rough reference point, not a target your specific page should hit.
What do the most-cited CTR studies actually show?
A few independent studies form the basis of most benchmarks cited in the industry:
| Study | Method | Headline finding |
|---|---|---|
| Backlinko clickstream analysis | Analysis across roughly 4 million Google search results | One of the most widely cited baseline CTR-by-position curves in SEO |
| SISTRIX keyword tracking | Tracking around 80 million keywords over time | Confirms a steep drop-off in CTR after position 3, with long-tail decline through page one |
| Ahrefs AI Overview study (2026) | ~300,000 keywords, split between queries with and without AI Overviews | Roughly 58% CTR reduction for top organic results when an AI Overview is present |
These studies don’t always agree on exact percentages, because they sample different query sets, industries, and time periods. What they agree on directionally: position 1-3 still captures a large share of clicks in the absence of heavy SERP features, CTR declines sharply through the rest of page one, and the presence of AI Overviews or other rich features materially reduces clicks even for the top organic position.
Why did CTR benchmarks change so much between 2024 and 2025?
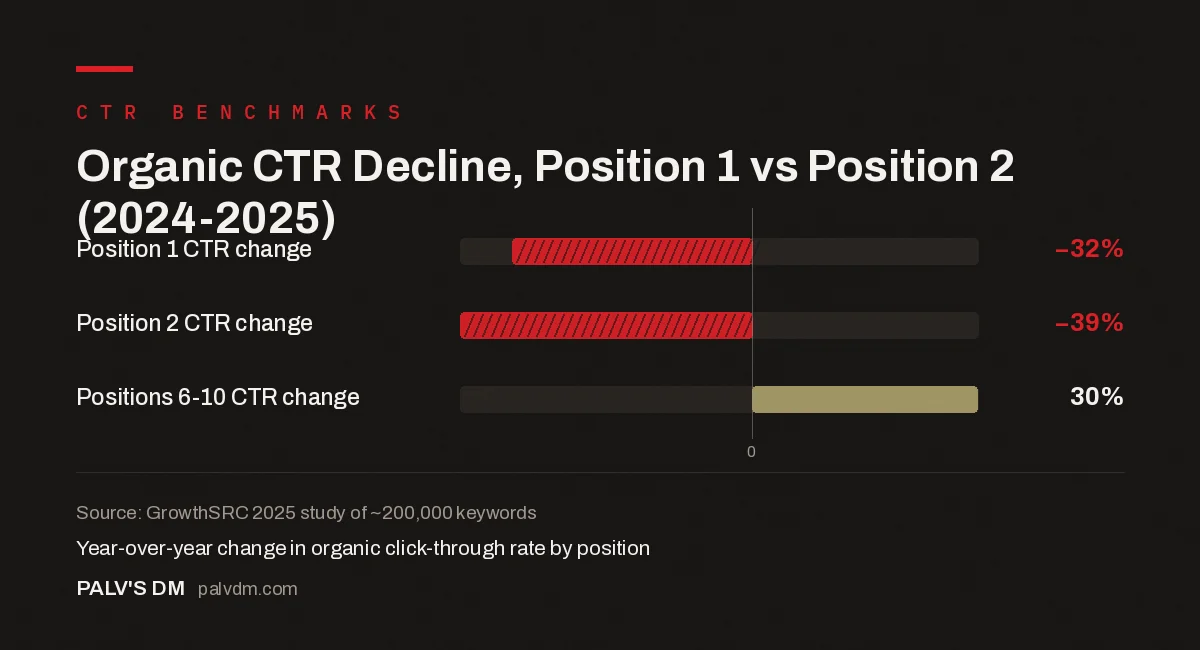
Organic CTR Decline, Position 1 vs Position 2 (2024-2025)
| Metric | Value |
|---|---|
| Position 1 CTR change | -32% |
| Position 2 CTR change | -39% |
| Positions 6-10 CTR change | 30% |
Source: GrowthSRC 2025 study of ~200,000 keywords
One widely cited 2025 study of roughly 200,000 keywords found organic CTR for position 1 fell by around 32% year over year, with steeper declines at position 2. The main driver cited across multiple studies is the growth of AI Overviews, which grew from a small fraction of queries in mid-2024 to appearing on a meaningful share of search results by 2026 — some estimates put it around 31% of queries, though this varies by industry and query type. Positions 6 through 10 told a different story in the same period, with CTR for those lower positions actually increasing in some studies, plausibly because searchers who scroll past an AI Overview without finding what they need are more likely to keep scrolling further down the page than they used to.
The practical implication: a CTR-by-position chart from 2023 is no longer a reliable reference. Any benchmark used for planning should be dated, and re-checked periodically rather than treated as a fixed table.
Why does CTR vary so much even at the same position?
- Search intent. A navigational query (someone searching your brand name) has a very different CTR profile than an informational query with ten competing “best of” articles.
- SERP features present. An AI Overview, featured snippet, People Also Ask box, or shopping carousel above the organic results all reduce how much attention reaches position 1.
- Title and meta description quality. Two pages at the same position can have meaningfully different CTR purely based on how compelling the snippet text is.
- Device. Mobile SERPs show fewer results above the fold, which changes the effective “position 1” experience compared to desktop.
- Branded versus non-branded queries. Branded searches convert to clicks at a much higher rate regardless of position, because the searcher already has a specific destination in mind.
How should you use CTR benchmarks in practice?
- Use your own historical CTR as the primary benchmark, not an industry-wide number. Compare a page’s current CTR against its own past performance at a similar position, since your audience’s behaviour is more relevant to your page than an aggregate study.
- Segment by query type before comparing. Don’t judge a branded query’s CTR against a competitive commercial query’s CTR — they’re not the same category of search.
- Check for SERP features before concluding a title/meta needs work. A CTR that looks low against a generic benchmark might simply reflect an AI Overview or featured snippet sitting above your result, which no snippet rewrite will fix.
- Treat industry benchmark charts as a sanity check, not a scorecard. If your position-1 pages are earning single-digit CTR across the board, that’s worth investigating. If they’re earning 15-20% versus a study’s cited 19-28% range, that’s within normal variation given how much SERP composition varies by query.
How does the “expected” CTR range shift by SERP feature type?
The single biggest variable in whether a benchmark chart is even useful for a specific query is what else is sitting on that results page. A rough guide to how much weight to put on a generic position-based benchmark, depending on what’s present:
| SERP feature present | Effect on organic CTR at position 1 | How useful is a generic benchmark here |
|---|---|---|
| None (plain organic results only) | Baseline, closest to published benchmark ranges | Reasonably useful |
| Featured snippet (not yours) | Reduced, since it captures attention above position 1 | Adjust benchmark downward |
| Featured snippet (yours) | Often increased versus standard position 1 | Generic benchmark understates your likely CTR |
| AI Overview present | Substantially reduced per multiple 2025-2026 studies | Generic position-based benchmark is not reliable here |
| Shopping carousel / heavy ads | Reduced, more so on commercial queries | Adjust benchmark downward significantly |
| Branded query, no major feature | Much higher than any generic non-branded benchmark | Ignore generic benchmarks entirely; use historical brand CTR |
The practical takeaway is the same one the studies point at directionally: a benchmark chart is a starting reference, not a number to defend or explain a specific page against without first checking what’s actually on that page’s results screen.
What does a CTR diagnostic actually look like on one page?
Take a page ranking at position 2 for a commercial keyword, earning a CTR the team flags as “low” against a generic benchmark chart showing position 2 organic results typically earning somewhere in the low-teens percentage range. Before touching the title tag, the first step is checking what’s actually on that SERP: in this case, a shopping carousel sits above the organic results, along with two sponsored listings. That alone likely accounts for most of the gap between the page’s actual CTR and the generic benchmark, since neither shopping results nor paid ads are part of what most published CTR-by-position studies are measuring against.
The second check is the page’s own trend over time rather than a single external number: has CTR at this position declined for this page specifically over the last two or three months, or has it stayed flat while the generic benchmark simply doesn’t match this SERP’s composition. If the page’s own CTR has held steady, the “problem” is largely a benchmark mismatch, not a snippet or relevance issue, and a title rewrite is unlikely to move the number much. If the page’s own CTR has genuinely dropped over time on a SERP whose composition hasn’t changed, that’s a real signal worth acting on, most often by testing a more specific title or meta description against what’s currently ranking above or beside it.
What can actually move CTR at a given position?
- A title tag that states a specific benefit or number rather than a generic description.
- A meta description that answers the implicit question behind the query, rather than restating the title.
- Structured data that earns a rich result (review stars, FAQ dropdown, recipe card) where relevant to the content type.
- Matching search intent precisely — a page that’s technically relevant but structured wrong for what the searcher expects (a product page for an informational query, for instance) will underperform its position regardless of snippet quality.
FAQs
What CTR should I expect at position 1?
Recent studies put position 1 organic CTR broadly in the high-teens to high-20s percentage range when no AI Overview or other heavy SERP feature is present, though this varies significantly by query type and has trended downward as AI Overviews have expanded. Use it as a rough reference, not a fixed target, since your specific niche and query mix will shift the real number.
Why is my CTR at position 3 higher than my CTR at position 1 for a different query?
This usually means the position-3 query has less competing SERP clutter (no AI Overview, no shopping results) or a more specific, high-intent match between the query and your title/meta description. Position alone doesn’t determine CTR; what else is on the page matters just as much.
Do AI Overviews always reduce CTR for organic results?
Not universally, but multiple 2025-2026 studies found a substantial average reduction, with one widely cited Ahrefs analysis finding roughly a 58% drop for top-ranking pages when an AI Overview appears. The effect size varies by query type, and some queries see a smaller impact than others.
Should I stop optimising for position 1 if AI Overviews are eating clicks?
No. Ranking well, including being cited within an AI Overview itself, still correlates with more total visibility than ranking lower. The more useful shift is measuring success by total qualified traffic and citations, not by CTR at a fixed position alone, since the meaning of “position 1” has changed.
How often do CTR benchmarks change?
Meaningfully, and more often than they used to. SERP feature adoption — particularly AI Overviews — has expanded quickly since 2024, which shifts the baseline. Treat any CTR benchmark study as a snapshot of a specific period rather than a permanent number, and re-check your own data every few months.
CTR is only one piece of reading Search Console correctly — see our guide to reading the Performance report for the fuller picture, and what impressions, clicks, and position each really measure if the relationship between these metrics still feels unclear. Our note on why average position gets misread covers a related, commonly confused metric.
If your CTR looks low across the board and you’re not sure whether it’s a snippet problem or a SERP-feature problem, PalV’s DM’s SEO Growth service includes this kind of diagnostic as part of ongoing reporting.