Reading the Search Console Performance Report Correctly
How to read the Google Search Console Performance report: what clicks, impressions, CTR, and position mean, and a step-by-step review process.

Published August 2026 · SEO team at PalV’s DM
The Google Search Console Performance report shows how your site appears in Google Search results, broken down by clicks, impressions, click-through rate (CTR), and average position, filterable by query, page, country, device, and search appearance. Reading it correctly means starting with clicks and impressions together, not average position alone, and always checking the date range and filters before drawing a conclusion — a chart that looks like a traffic drop is often just a comparison against an unusually strong prior period, or a filter left on from the last session.
What does each metric in the Performance report actually mean?
| Metric | What it measures | Common misreading |
|---|---|---|
| Clicks | Times someone clicked through to your site from a Google search result | Assuming this equals sessions in GA4 — it doesn’t, exactly |
| Impressions | Times your URL appeared in search results, even if not scrolled into view | Treating every impression as a real “view” by a person |
| CTR | Clicks divided by impressions | Comparing CTR across queries at very different average positions |
| Average position | The mean ranking position across all impressions for a query or page | Reading it as “your rank,” when it’s an average across many different result placements |
Google’s own Search Console documentation is explicit that these numbers come from Google’s systems and can differ from third-party rank trackers or analytics tools, because each measures a different thing at a different point in the user’s journey.
How should you actually read the report, step by step?
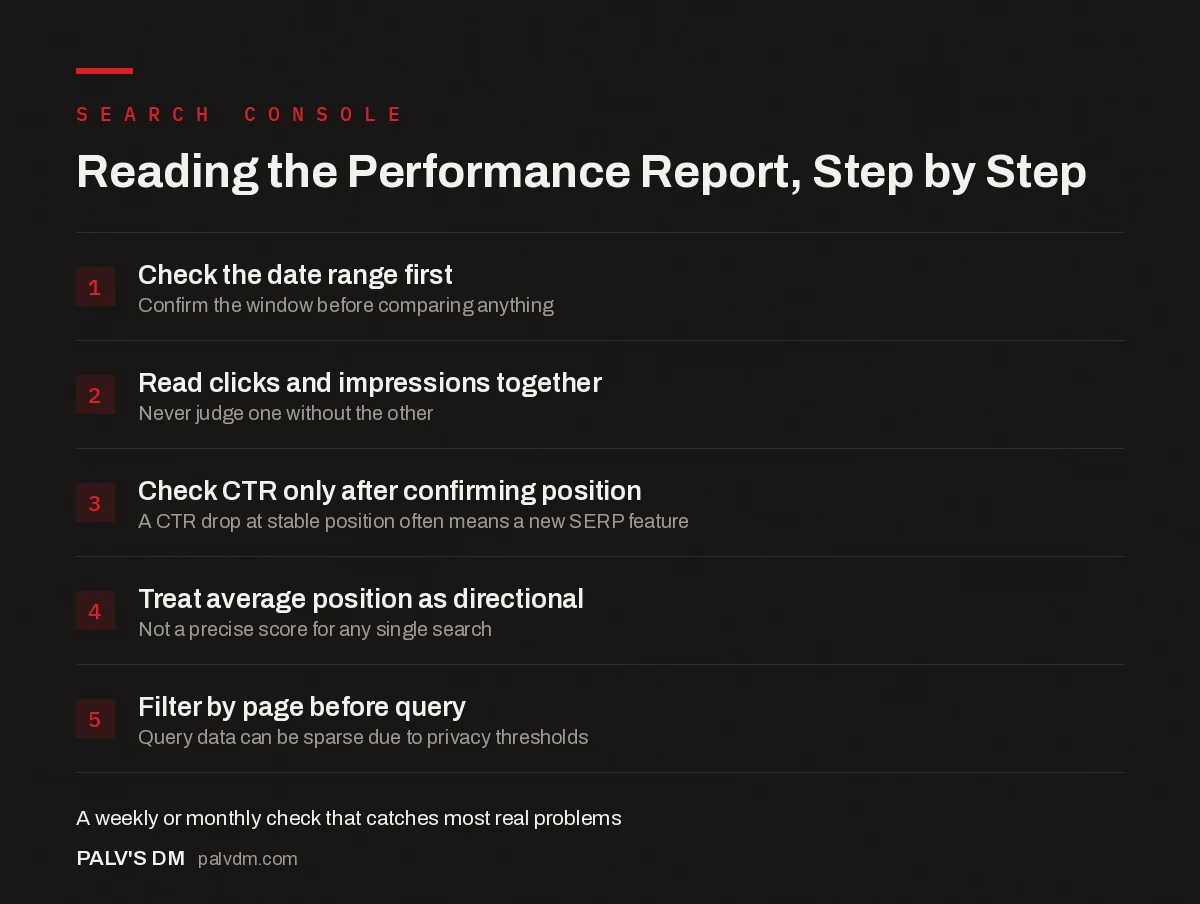
Reading the Performance Report, Step by Step
- Check the date range first. Confirm the window before comparing anything.
- Read clicks and impressions together. Never judge one without the other.
- Check CTR only after confirming position. A CTR drop at stable position often means a new SERP feature.
- Treat average position as directional. Not a precise score for any single search.
- Filter by page before query. Query data can be sparse due to privacy thresholds.
- Start with the date range. Search Console defaults to the last three months in some views and the last 28 days in others depending on where you enter the report — confirm the range before comparing anything.
- Look at clicks and impressions together, not in isolation. Rising impressions with flat clicks usually means visibility is improving but CTR isn’t; falling impressions with flat clicks might mean fewer queries are triggering your page at all.
- Check CTR only after confirming position hasn’t shifted. A CTR drop at a stable position is a genuine signal worth investigating — often a SERP feature (an AI Overview, a featured snippet, a new ad unit) is now sitting above your result. A CTR drop paired with a position drop is simpler: you’re just ranking lower.
- Use average position as a directional signal, not a precise score. It moves for reasons that have nothing to do with your page’s quality, including which queries triggered impressions that day.
- Filter by page before filtering by query when troubleshooting a specific URL, since query-level data can be sparse or filtered out entirely by Google’s data thresholds for privacy.
Why do the numbers sometimes look wrong or incomplete?
- Data sampling and thresholds. Search Console omits some low-volume queries entirely for privacy reasons, which can make total clicks/impressions not sum neatly against the query-level breakdown.
- A 2-3 day data lag. The most recent two to three days are usually incomplete, so a sudden-looking dip at the very end of a date range is often just unfinished data, not a real drop.
- Filters left on from a previous session. A country, device, or search-type filter applied last week and forgotten will silently narrow every report until it’s removed.
- Property type confusion. A domain property and a URL-prefix property for the same site can show different numbers if both exist, since they’re not always tracking identically scoped data.
What should you actually do with this report weekly or monthly?
A simple recurring check that catches most real problems without becoming a full-time job:
- Compare the current 28-day window against the prior 28 days for total clicks and impressions — a swing beyond normal variance warrants a closer look.
- Sort pages by impressions with low CTR to find pages that are visible but not compelling enough in the snippet to earn clicks — often a title tag or meta description fix, not a content fix.
- Sort queries by position 5-15 with reasonable impressions — these are your best near-term ranking opportunities, since they’re already relevant enough to show up but not yet winning the click.
- Check the Pages tab for any URL with a sharp, sudden drop and cross-reference it against the Coverage/Indexing report for technical issues before assuming it’s a content or ranking problem.
What are the most common mistakes teams make with this report?
A few patterns show up repeatedly when reviewing how teams actually use this report day to day:
- Reacting to single-day spikes or dips. Daily data is noisy, especially on smaller sites. A one-day change rarely means anything on its own; look at week-over-week or month-over-month trends instead.
- Comparing CTR across completely different query types. A branded query and a competitive commercial query have naturally different CTR baselines. Comparing them directly and concluding one page is “underperforming” the other is comparing unlike things.
- Ignoring the Search Appearance filter. Rich results, FAQ snippets, and other search appearance types carry different CTR expectations than plain blue links, so filtering by appearance type before judging CTR gives a fairer read.
- Not segmenting by device. Mobile and desktop CTR and position patterns can diverge meaningfully, and a site with a weak mobile experience often shows the gap here before it shows up anywhere else.
What does a real weekly review look like on actual numbers?
Take a mid-size content site reviewing its Performance report on a Monday. The 28-day comparison shows clicks down 8% but impressions up 4% against the prior period. Read separately, that could mean several things; read together, it narrows fast: more visibility but a lower conversion rate from impression to click, which points at CTR rather than a ranking or indexing problem.
Sorting pages by impressions with low CTR turns up a category guide getting 12,000 impressions a month at a 1.8% CTR, well below the site’s typical 3-4% for similar informational pages. Checking the query data behind it, the page ranks around position 6-7 for its main term, respectable but not top-3, and the SERP for that query now shows an AI Overview above the organic results, something that wasn’t there the last time anyone checked. That single change accounts for most of the CTR gap; the ranking itself hasn’t moved. The fix isn’t a content rewrite, it’s testing a title tag that answers the query’s core question more directly, since pages that get pulled into or referenced by an AI Overview sometimes recover some clicks that a plain ranking wouldn’t.
Meanwhile the queries-by-position sort turns up two terms sitting at position 9-11 with several hundred impressions each, both closely related to a service the site sells. Neither has enough content depth on the current ranking page to compete for the top five, which makes them a reasonable target for the next content update rather than a new page, since consolidating effort on an existing near-miss page usually moves faster than starting from zero.
How does this report connect to the rest of your SEO measurement?
Search Console shows what happens on Google’s side — impressions, clicks, and position in the search results themselves. It does not show what happens after the click: bounce rate, time on page, or conversions. That’s GA4’s job, and the two reports rarely match exactly, which is normal rather than a sign either tool is broken. Reading them side by side, rather than picking one as the “true” number, gives a fuller picture of both visibility and what happens once someone actually lands on the page.
FAQs
Why do total clicks in the summary not match the sum of clicks per query?
Google Search Console omits some low-volume, rare, or personally identifiable queries from the query-level breakdown for privacy reasons, even though those clicks still count in the site-wide total. This gap is expected and usually larger on smaller sites with more long-tail query variety.
How far back does Search Console Performance data go?
The standard Performance report shows up to 16 months of history for most properties. Anything before that isn’t available in the standard interface, so sites wanting longer historical tracking need to export data regularly or use the Search Console API to build their own archive.
Is a high average position always good?
Not necessarily on its own. A query with an average position of 3 but almost no impressions might be a rare, low-value search term, while a query at position 8 with thousands of impressions represents far more real opportunity. Position needs impressions and clicks alongside it to mean anything.
Why does the Performance report show data for pages that don’t exist anymore?
Search Console reflects Google’s index, which can lag behind your live site by days or weeks. A deleted or redirected page can keep showing impressions until Google fully recrawls and updates its index, which isn’t a bug so much as a normal processing delay.
Should I trust Search Console data more than a third-party rank tracker?
They measure differently and neither is simply “more correct.” Search Console reflects real impressions and clicks from actual users; a rank tracker simulates searches from fixed locations and devices, which can show different numbers for the same keyword. Use Search Console for real user behaviour and a rank tracker for consistent day-to-day position monitoring.
The Performance report is one part of a larger toolkit — see our Google Search Console guide for the other reports worth checking regularly. Once you’re comfortable reading clicks and impressions, understanding what each metric really measures and why average position gets misread so often go a level deeper.
If your team needs help turning Search Console data into an actual action plan, PalV’s DM’s SEO Growth service includes monthly reporting built around exactly this kind of analysis.