Why Average Position Is the Most Misread Metric in GSC
Average position in Search Console is widely misread. Here's why the metric hides real ranking problems and what to check instead.
Published August 2026 · SEO team at PalV’s DM
Average position in Google Search Console is the most misread metric in the report because people treat it as “your rank,” when it’s actually a mean calculated across every impression for a query or page, including wildly different individual placements. A page showing an average position of 10 might never have actually ranked at position 10 for a single search, it could be an even split between position 2 and position 18, or a dozen other combinations that produce the same average while describing completely different real-world visibility. Search Engine Journal and other industry publications have specifically called out this metric as one worth de-emphasising in favour of clicks and impressions.
How do agencies and in-house teams typically misuse this metric?
The most common misuse is reporting average position movement to a client or a manager as the headline SEO win of the month, without checking whether it’s backed by matching movement in clicks and impressions for the actual priority keywords. A page can show “average position improved from 14 to 9” while the keyword that matters to the business barely moved, because the average was pulled up by unrelated long-tail queries picking up impressions elsewhere. Reporting that number alone, without the underlying query breakdown, tends to create a false sense of progress that shows up later when it doesn’t translate into revenue or leads.
Why is “average” the wrong mental model here?
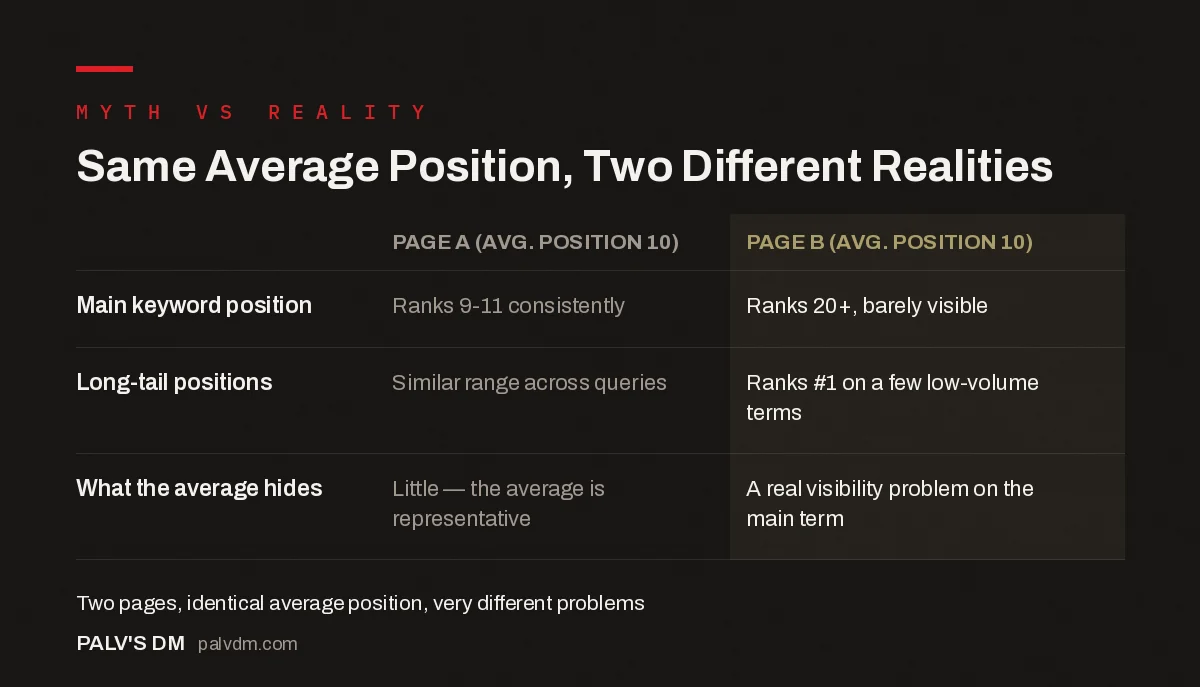
Same Average Position, Two Different Realities
| Page A (avg. position 10) | Page B (avg. position 10) | |
|---|---|---|
| Main keyword position | Ranks 9-11 consistently | Ranks 20+, barely visible |
| Long-tail positions | Similar range across queries | Ranks #1 on a few low-volume terms |
| What the average hides | Little, the average is representative | A real visibility problem on the main term |
An average works well when the underlying values cluster fairly tightly. Average position rarely does. A single page can rank differently by device, by exact query variant, by user location, and even by time of day depending on how Google’s results personalise or test variations. Averaging across all of that produces a number that’s mathematically correct but describes no single real search result.
Two pages can have an identical average position of 10 and mean completely different things:
| Scenario | Average position | What’s actually happening |
|---|---|---|
| Page A | 10 | Ranks consistently around position 9-11 for its main queries |
| Page B | 10 | Ranks #1 for a handful of low-volume queries, and position 20+ for its main target keyword |
Page A has a genuinely middling position worth working on directly. Page B has a real problem hiding behind a deceptively reasonable-looking average, its main keyword is barely visible, but a few easy long-tail wins are propping up the headline number.
What causes average position to move for reasons unrelated to actual ranking improvement?
- A shift in which queries are triggering impressions. Gaining impressions on easier, lower-competition queries while losing them on harder ones can improve the average without any single query’s rank actually changing.
- Seasonal query mix changes. Search behaviour shifts through the year, and the set of queries triggering a page’s impressions in December may differ from June, changing the average independent of ranking quality.
- New pages or content on the site. A newly published page competing for overlapping queries can shift which URL gets attributed the impression, indirectly moving another page’s average position.
- Google testing or personalisation. Not every ranking position a user sees is identical across users, and Search Console’s average reflects a blend of all of them.
What does this look like with real numbers?
Take a services page that ranks for roughly 40 distinct queries in a given month. In week one, it earns impressions mostly from three high-volume commercial terms sitting around position 14-16, plus a scattering of long-tail queries at position 3-5. The blended average lands around position 11. By week four, the page has picked up a burst of impressions from 15 new low-competition, low-volume queries where it happens to rank position 1-2, while the original commercial terms haven’t moved at all. The average position now reads closer to position 6, a five-position “improvement” that a monthly report might present as a win. Nothing about the page’s actual competitiveness on its priority terms changed; the query mix behind the average simply shifted. Pulling the query-level export for just those three original commercial terms would show flat performance the whole time, which is the number that should have driven the reporting conclusion.
How does AI Overview growth make this even messier?
Average position was already a blend of very different real placements before AI Overviews became common. Now the metric has to somehow represent pages that appear both as a traditional blue link and, on some queries, as a source cited within an AI Overview, which sits in a different part of the page entirely and behaves differently in terms of visibility and click behaviour. Search Engine Journal and other outlets have raised this exact point: as SERP layouts diversify further, a single averaged number increasingly struggles to represent what’s actually happening on the page. This is one more reason to treat average position as a rough trend line rather than a precise diagnostic tool going forward.
What should you check instead of, or alongside, average position?
- Impressions and clicks for the specific target query, filtered directly rather than relying on the page-level average across all queries.
- The distribution of positions, not just the mean, where possible, exporting query-level data into a spreadsheet and looking at the spread gives a much clearer picture than the single averaged number.
- Position trends for your 5-10 actual priority keywords specifically, tracked individually rather than folded into a page-wide or site-wide average.
- A dedicated rank tracker for consistent, comparable position data on your most important terms, since it measures from fixed conditions rather than blending real, variable user contexts the way Search Console does.
Is average position ever useful?
Yes, as a very rough directional signal over a long time horizon, if a page’s average position has trended from 25 down to 12 over six months, that’s a meaningful directional improvement even without knowing the exact distribution behind each number. It’s useful for spotting broad trends and useless for precise diagnosis. The mistake isn’t using average position at all; it’s using it as if it were as precise as clicks or impressions.
How should this change what you report to clients or leadership?
The practical fix isn’t dropping average position from reports entirely, it’s never presenting it alone. Pairing the page-level average with a small query-level table for the priority terms that actually matter to the business turns a potentially misleading headline number into useful context. A report that says “average position moved from 14 to 9, driven mainly by a new set of long-tail queries; our three priority terms held steady at position 6, 11, and 19” tells a stakeholder something they can act on. The same report showing only “average position: 9, up from 14” invites a false conclusion that took real work to earn but no work to correct once someone asks the follow-up question.
FAQs
Why does my average position look good but my traffic doesn’t reflect it?
This is the classic symptom of the metric hiding a skewed distribution, strong average position propped up by low-value, high-position long-tail queries while your actual target keyword sits much lower. Check query-level data for your priority terms specifically rather than trusting the page-wide average.
Can average position be below 1?
No, since positions start at 1, so the theoretical minimum average is 1.0, meaning every impression occurred at the very top result. In practice this is extremely rare outside of branded queries with no real competition.
Does Search Console show median position instead of average anywhere?
No, Search Console’s standard interface only reports the mean (average) position, not median or a distribution. Getting a distribution view requires exporting query-level data via the API or the bulk export option and calculating it separately.
Why do two similar pages on my site show very different average positions?
This usually reflects genuine differences in how competitive their target queries are, how well-optimised each page is for those queries, or how much internal linking and authority each page has accumulated. It can also reflect one page ranking for a wider, more varied set of queries than the other, which changes what’s being averaged.
Should I set average position as a KPI for my SEO team?
It’s better used as a supporting metric than a primary KPI. Because it can improve or worsen for reasons unrelated to real visibility gains, teams that optimise directly for average position sometimes end up chasing an easily-gamed number instead of the clicks, impressions, and conversions that actually matter to the business.
How many queries does a page need before its average position becomes unreliable?
There’s no fixed threshold, but the risk grows with the number of distinct queries feeding the average. A page ranking for only 3-4 closely related queries produces a fairly representative average. A page pulling impressions from 200+ varied queries, spanning very different search intents and competitiveness levels, produces an average that’s mathematically valid but practically uninformative without breaking the query set into smaller, more coherent groups first.
Average position makes more sense once you understand how it relates to the other core metrics, see our breakdown of what impressions, clicks, and position each really measure, and our guide to reading the Performance report correctly for the full context. Filtering by query regex patterns is one practical way to isolate the specific query groups where average position is hiding real detail.
If average position swings are causing confusion in your reporting, PalV’s DM’s SEO Growth service builds reporting around metrics that actually reflect what’s changing, not just the ones that are easiest to pull.