Annotating Algorithm Updates in Your Reporting
How to annotate Google updates as date bands, log your own deploys alongside them, and stop every traffic drop being blamed on the algorithm.
Annotate algorithm updates as date bands, not single lines: record the confirmed start and completion dates from Google’s Search Status Dashboard, mark unconfirmed volatility in a visibly different style, and annotate your own deployments with exactly the same rigour. An annotation layer that contains only Google’s updates will make every drop look like Google’s fault, which is wrong most of the time. The version that earns its place holds three streams — confirmed Google updates, your own releases, and business events like a price change or a campaign launch — on one timeline.
The point of annotating is not decoration on a chart. It is that six months later nobody remembers what shipped in the week traffic fell, and reconstructing it from memory produces a confident, wrong story.
What should you actually annotate?
Three streams, kept visually distinct so a reader can tell at a glance which kind of event they are looking at.
- Confirmed Google updates. Only what appears on Google’s Search Status Dashboard: core updates, spam updates, and published disruptions to crawling, indexing, serving or ranking. Record start date, completion date and the incident identifier.
- Your own changes. Deployments, template changes, robots.txt and canonical edits, redirects, migrations, CMS or plugin upgrades, content pruning, navigation changes. These cause more traffic movement than algorithm updates do, and they are the stream almost every reporting setup omits.
- Business and market events. Campaign launches, price changes, stock outages, seasonal peaks, PR coverage, a competitor’s relaunch. A festive spike is not an algorithmic win.
Unconfirmed volatility deserves a fourth, clearly subordinate treatment. Tracker spikes are worth logging as context, but they must never be styled the same as a confirmed update. Confirmed versus unconfirmed updates explains why the distinction is not pedantry: presenting tracker movement as an update is how a report ends up contradicted by the dashboard a fortnight later.
Why annotate a rollout as a band rather than a line?
A single vertical line on a start date implies the effect landed that day. It rarely does. Core update rollouts run for days and rankings genuinely swing inside the window before settling.
Recent confirmed durations make the case:
| Update | Started | Completed | Duration |
|---|---|---|---|
| December 2025 core update | 11 Dec 2025 | 29 Dec 2025 | 18 days |
| February 2026 Discover core update | 5 Feb 2026 | 27 Feb 2026 | 22 days |
| March 2026 spam update | 24 Mar 2026 | 25 Mar 2026 | Under 24 hours |
| March 2026 core update | 27 Mar 2026 | 8 Apr 2026 | 12 days, 4 hours |
| May 2026 core update | 21 May 2026 | 2 Jun 2026 | ~12 days |
Shading the whole window rather than marking a single day tells the reader something true: no conclusion drawn inside that band is safe. The May 2026 core update produced large movement on 23 May, more on 30 May, and further volatility in the final twenty-four hours before Google marked it complete. Anyone who annotated only 21 May and read the chart on 24 May reached a conclusion the data reversed a week later. Every confirmed 2026 date sits in the 2026 update timeline.
Where can you actually store annotations?
There is no single tool that does all of it, so most teams end up with a source of record plus one or two display layers.
- A spreadsheet or database as the source of truth. One row per event with fixed columns, owned by you and portable between tools. This is the only layer that survives a change of analytics platform, and it is what a maintained SEO update log is for.
- Google Analytics 4 annotations. GA4 supports annotations on reports, so update bands and release notes can sit directly against the traffic graph the client already looks at.
- Search Console plus an export. Search Console has no annotation feature, so the Performance data has to be exported — via the interface or the Search Console API — and annotated wherever you build the chart.
- Your reporting dashboard. Whichever tool renders the monthly report should read from the same annotation table rather than holding its own copy. Two annotation sets always diverge.
What fields should an annotation record hold?
| Field | Why it earns its place |
|---|---|
| Start date and end date | Lets you render a band and excludes the rollout from comparison windows |
| Type | Google update, own change, business event, or unconfirmed volatility |
| Confirmation source | Dashboard incident ID, release ticket, or the tracker name for unconfirmed items |
| Scope | Whole site, a section, a template, a country, or Discover rather than Search |
| Owner | Who made the change, so the follow-up question has an address |
| Observed effect | Filled in afterwards, once the rollout has completed and the data has settled |
The last field is the one people skip and the one that makes the log valuable. An annotation that records only that an update happened tells you nothing next year. One that records what happened to your specific templates becomes the evidence base for the next diagnosis.
How do you use annotations without misreading them?
An annotation marks correlation in time. It does not establish cause, and a chart that puts a line next to a drop invites everyone in the room to assume it does.
Two disciplines keep it honest. First, exclude the rollout window from comparison periods — compare equal-length periods that both sit fully outside the band, rather than one window that straddles it, which produces a meaningless blend. Choosing the right comparison window covers the mechanics. Second, check the annotation against your own release stream before attributing anything, because a deploy on the same day as a core update start is not a coincidence you can afford to ignore. Update or self-inflicted sets out that check, and confirming update impact covers the evidence needed before you claim an update did anything to you at all.
A monthly routine that keeps the log alive
- Review the Search Status Dashboard. Log any new update or disruption with its dates and identifier, and close out anything that completed during the month.
- Pull the release log. Ask the development team for everything shipped, including the changes nobody thought were SEO-relevant. Those are usually the ones that were.
- Fill in observed effects for events that have now finished, segmented by template and query cluster rather than as a single site-wide number.
- Demote anything that stayed unconfirmed. Tracker spikes that Google never acknowledged should be marked as such permanently, not quietly promoted to “the August update”.
- Carry the band into the report. The monthly report should show the same annotation layer the analyst used, so nobody argues from two different timelines.
Done properly, this takes twenty minutes a month and turns the question “what happened in May?” from a guess into a lookup. It also changes the conversation after a drop, because the post-update conversation with a client goes very differently when the answer starts with a dated record rather than a theory. The same log is what stops a traffic drop diagnosis beginning at the algorithm instead of ending there.
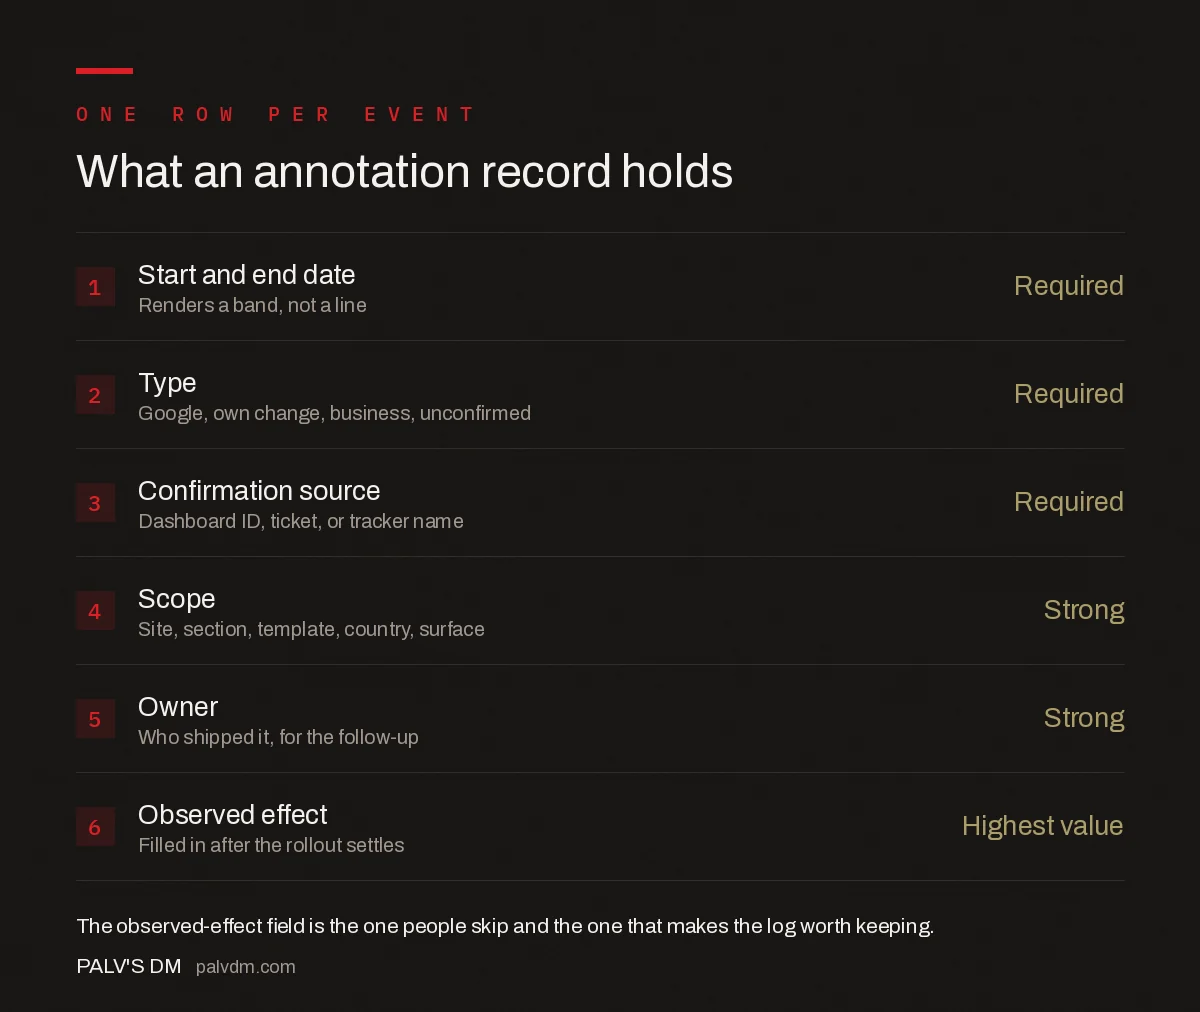
What an annotation record holds
- Start and end date — Required. Renders a band, not a line.
- Type — Required. Google, own change, business, unconfirmed.
- Confirmation source — Required. Dashboard ID, ticket, or tracker name.
- Scope — Strong. Site, section, template, country, surface.
- Owner — Strong. Who shipped it, for the follow-up.
- Observed effect — Highest value. Filled in after the rollout settles.
Frequently asked questions
How should I annotate a Google core update in reporting?
Annotate it as a shaded band covering the confirmed start and completion dates from Google’s Search Status Dashboard, not a single vertical line on the start date. Recent core updates ran 12 to 18 days and rankings swing inside that window before settling, so any conclusion drawn mid-rollout is unsafe. Record the incident identifier alongside the dates.
Does Google Search Console support annotations?
No. Search Console has no built-in annotation feature, so the annotation layer has to live elsewhere. The usual approach is to keep a spreadsheet or database as the source of truth, export Search Console Performance data through the interface or the Search Console API, and render the annotated chart in your reporting tool. Google Analytics 4 does support annotations on reports.
What should I annotate besides algorithm updates?
Your own changes and your business events. Deployments, template changes, robots.txt and canonical edits, redirects, migrations, plugin upgrades and content pruning cause more traffic movement than algorithm updates do. Business events such as campaign launches, price changes, stock outages and seasonal peaks explain movement that would otherwise be blamed on Google.
Should I annotate unconfirmed algorithm updates?
Log them as context, but style them differently from confirmed updates and never promote them later. Third-party volatility trackers show that results moved, not that Google moved them. In August 2026, for example, several trackers registered spikes while Google’s Search Status Dashboard showed no ranking, indexing, crawling or serving incident at all in that window.
How do annotations change how I compare periods?
They tell you which periods to exclude. Compare equal-length windows that both sit fully outside a rollout band rather than one window that straddles it, because a straddling comparison blends pre-update and mid-update data into a number that means nothing. The annotation band is what makes those boundaries visible when you set the comparison up.
How often should the update log be maintained?
Monthly is enough for most sites and takes around twenty minutes. Review Google’s Search Status Dashboard for new or completed entries, pull the development release log including changes nobody flagged as SEO-relevant, fill in observed effects for events that have now finished, and carry the same annotation layer into the client report so everyone argues from one timeline.
Sources
- Google Search Status Dashboard
- About annotations — Analytics Help
- Performance report (Search results) — Search Console Help
- Google core updates and your website — Search Central
Want this done on your site?
Every PalV’s DM engagement starts with a free audit of your actual website — a 12-point
crawl covering what is blocking indexation, on-page gaps against your primary keywords, speed
findings, and the three to five fixes worth making first. Delivered in two working days. No
payment details, and the findings are yours whether you hire us or not.