Citing Your Own Data: Turning Client Work Into Authority
Your own numbers are the one input competitors cannot copy. How to collect, anonymise and publish proprietary data so readers and AI engines can cite it.
Your own data is the only content input a competitor cannot copy, and it is the most reliable form of information gain available to a small business. Every rival can paraphrase the same guides, quote the same industry reports and restate the same advice. Nobody else has your crawl logs, your support tickets, your quote-to-close rates or the results of the tests you actually ran. Google’s helpful content guidance asks whether a page provides original information, reporting, research or analysis, and peer-reviewed work on generative engine optimisation found that adding statistics lifted a source’s visibility in AI answers by up to around 40%. Proprietary data satisfies both at once.
The complication is that most of the data worth publishing belongs to clients, sits in tools you do not own, or was never recorded in a shape that survives aggregation. Turning delivery work into publishable evidence is an operational habit rather than a writing task, and it has to be built into how work is done rather than retrofitted when a blog post is due.
What actually counts as your own data?
Far more than most consultancies realise. The test is whether you observed it directly and can describe how it was measured.
| Source | What it can support | Effort to collect |
|---|---|---|
| Crawl exports across client sites | Prevalence of technical issues by site size or platform | Low — already generated in delivery |
| Search Console exports you have access to | Click-through behaviour, impression patterns, query mix | Low, but needs consent to aggregate |
| Quotes, proposals and enquiries | Pricing spread, budget expectations, common scope requests | Low — your own records |
| Support tickets and client questions | What buyers genuinely misunderstand, in their own words | Low, if logged |
| Deliberate tests you ran | Before-and-after effects with a stated method | High — needs design and patience |
| Surveys of your own audience | Attitudes and adoption in your specific market | Medium, and sample size is the constraint |
The top four rows are the ones worth starting with, because the data already exists as a by-product of work you are doing anyway. That is the practical difference between first-party data content and commissioning original research: one is a reporting habit, the other is a project.
How do you publish client data without breaching confidentiality?
This is the objection that stops most consultancies, and it is solvable with four rules rather than a lawyer on retainer.
Aggregate, never itemise. “Across 62 WordPress sites we crawled between January and June 2026” is publishable. “Client X had 340 broken internal links” is not, unless they have agreed to it in writing. Aggregation is what converts confidential delivery output into a dataset.
Set a minimum sample and stick to it. Below roughly twenty observations, aggregation stops protecting anyone, because a reader in the same niche can guess who is in the set. It also stops being a finding and becomes an anecdote.
Strip the identifying combination, not just the name. Sector plus city plus revenue band plus platform will identify a business even with the name removed. Publish one or two dimensions, not four.
Get permission in the contract, not by email later. A short clause allowing anonymised, aggregated use of engagement data for research and marketing removes the awkward conversation entirely. In India, handling of personal data also sits under the Digital Personal Data Protection Act, and what the DPDP Act means for marketing is worth reading before any dataset touches individual-level records.
Named case studies are a separate thing with a separate permission process. If a client will go on the record with real numbers, that is stronger still — how to write case studies that hold up covers the format, and how buyers evaluate case studies explains why vague ones are counterproductive.
How do you make a dataset actually citable?
A number without a method is a claim, and a claim is not citable. Six elements convert one into the other, and all six should appear on the page carrying the data.
- Sample size, stated as a number. Not “many sites”. The count, and what a unit of the sample is.
- Date range. Data ages. A finding from a crawl in March 2026 should say March 2026, because a reader in 2028 needs to know.
- How it was collected. Which tool, which settings, which exclusions. Publishing the methodology alongside the finding is what separates research from an assertion.
- Definitions. If you report “thin pages”, say exactly what threshold you used. Undefined terms make a number unusable to anyone else.
- At least one stated limitation. Selection bias is almost always present — your clients are not a random sample of the internet. Saying so increases credibility rather than reducing it.
- A stable, linkable home. One page per dataset, with a permanent URL, so other people can cite it. That is the mechanism behind statistics pages as link assets.
What does the evidence say about publishing statistics?
The strongest available evidence is Aggarwal et al., GEO: Generative Engine Optimization, presented at KDD 2024. The study tested content modifications against generative engine responses and found that adding statistics, quotations from named sources and citations to authoritative sources raised source visibility in generated answers by up to roughly 40%, while keyword stuffing performed worse than making no change at all.
Two cautions matter when applying that finding. First, it measures visibility within generated answers, not classic rankings — they are different surfaces, which is the whole argument of SEO in the age of AI search. Second, the mechanism rewards statistics that are attributable. A number with a source and a method is quotable; a number floating in a sentence is noise, and how statistics affect AI citation depends entirely on that distinction.
How do you write a data sentence an engine can quote?
A quotable data sentence is self-contained. It carries the finding, the sample, the period and the source inside one sentence, so that when a retrieval system lifts it out of your page it still makes sense with no surrounding context.
The shape to aim for: subject, measured value, sample size, time period, method reference. A sentence built that way survives extraction. A sentence that says “as shown above, the figure was significantly higher” dies the moment it leaves the page, which is the orphan-pronoun problem that makes otherwise good content uncitable.
Put the headline figure in the first 100 words of the article and repeat it verbatim in the FAQ block, using the same wording both times. Consistency of phrasing matters more than variety here, because paraphrasing your own statistic three different ways gives an engine three candidate versions and no way to choose. This is the same principle behind adding original data to existing content rather than writing a separate research post nobody reads.
How do you turn delivery work into a dataset?
The workflow below assumes a consultancy doing client work, not a research team.
- Add the permission clause to your standard contract so every future engagement is covered by default.
- Pick one recurring artefact that delivery already produces — a crawl export, an audit scorecard, a proposal record.
- Define the fields once and log them in the same shape every time. Inconsistent logging is what kills these projects in month three.
- Set a publication threshold, for example twenty engagements or six months, and do not publish before it.
- Write the method page first, before you look at the results. Deciding the method after seeing the numbers is how honest people end up with dishonest findings.
- Publish, date it, and refresh on a stated cadence. A dataset updated annually with the date visible beats a one-off that quietly rots.
Where should your data live on the site?
A dataset needs one permanent home and several borrowed appearances. The permanent home is a dedicated statistics or research page carrying the full method, the sample, the date range and the complete set of findings. That page is what other people link to and what you update when the data refreshes, which is the argument for maintaining a statistics page as a citation asset rather than burying findings in a blog archive.
The borrowed appearances are the individual figures, quoted inside whichever articles they genuinely support, each linking back to the method page. One number in a relevant guide does more work than the same number sitting in a research post that gets forty visits a year. Original research and AI visibility depends on that distribution: engines cite the page that answers the question, so the statistic has to sit where the question is being answered.
Keep the wording identical across every appearance. If the research page says “62 WordPress sites crawled between January and June 2026” then every article quoting it should use that exact phrasing, so a retrieval system sees one consistent claim rather than four near-duplicates.
What not to do
- Do not invent a number to fill a gap. A fabricated statistic that gets cited elsewhere is unrecoverable, and it is the fastest way to destroy the asset you are trying to build.
- Do not round to make a sentence flow. If the figure is 41.3%, it is not “over half”.
- Do not present a vendor’s data as your own. Cite the vendor. Reusing someone else’s figures is fine; laundering them is not.
- Do not publish a finding from three clients as a trend. Call it an observation and say the sample is three.
- Do not bury the method in a PDF. If the method is not on the page in HTML, it cannot be read by the systems most likely to cite you.
The reason to bother is narrow and durable. Information gain is the one property of a page that cannot be replicated by a competitor with a better budget and a faster writer, and original data is the purest form of it. Everything else on your site can be out-researched. Your own numbers cannot.
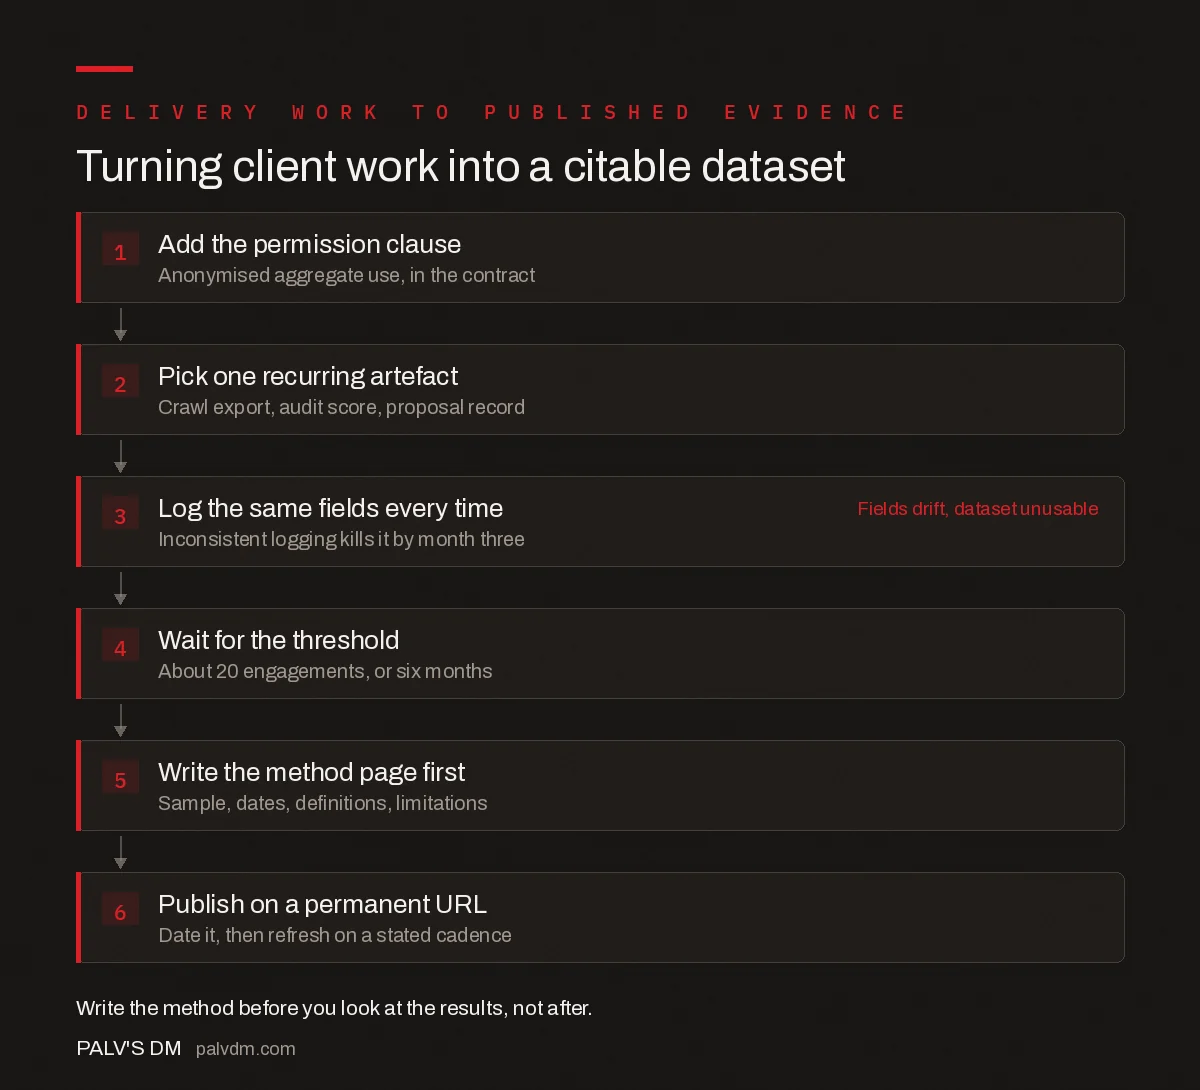
Turning client work into a citable dataset
- Add the permission clause. Anonymised aggregate use, in the contract.
- Pick one recurring artefact. Crawl export, audit score, proposal record.
- Log the same fields every time. Inconsistent logging kills it by month three. Fields drift, dataset unusable
- Wait for the threshold. About 20 engagements, or six months.
- Write the method page first. Sample, dates, definitions, limitations.
- Publish on a permanent URL. Date it, then refresh on a stated cadence.
Frequently asked questions
What counts as proprietary data for content?
Anything you observed directly and can describe the collection method for: crawl exports across the sites you work on, aggregated Search Console data you have access to, your own quote and enquiry records, logged support questions, results of tests you deliberately ran, and surveys of your own audience. The defining property is that no competitor can reproduce it.
Can I publish client data in blog posts?
Only in aggregated, anonymised form, and only with permission. Report across a stated sample rather than naming individuals, keep the sample above roughly twenty observations, and strip identifying combinations of attributes rather than just the client name. The cleanest route is a short clause in your standard contract permitting anonymised aggregate use for research and marketing.
How large does a sample need to be to publish?
There is no universal threshold, but below about twenty observations aggregation stops protecting anonymity and the finding stops being a trend. If your sample is smaller, publish it as a stated observation with the sample size visible rather than as a percentage. A percentage derived from five cases invites more scepticism than the finding is worth.
Does publishing original data help with AI citations?
The peer-reviewed GEO study presented at KDD 2024 found that adding statistics, named quotations and citations to authoritative sources raised source visibility in generative engine responses by up to around 40%, while keyword stuffing performed worse than baseline. The effect depends on the statistic being attributable, with a stated sample, date and method.
What has to accompany a statistic to make it citable?
Six things: the sample size as a number, the date range the data covers, how it was collected including tools and exclusions, definitions of any term being counted, at least one stated limitation such as selection bias, and a permanent URL where the dataset lives. A number without a method is a claim rather than evidence.
Is a small consultancy big enough to publish original research?
Yes, if you report what delivery already produces rather than commissioning a study. Crawl exports, audit scorecards, proposal records and logged client questions accumulate into a dataset within months at no extra cost. The constraint is consistent logging from the start, not scale — a well-documented sample of forty beats an undocumented sample of four hundred.
Sources
- Creating helpful, reliable, people-first content — Google Search Central — asks whether content provides original information, reporting or research
- GEO: Generative Engine Optimization (Aggarwal et al., KDD 2024) — peer-reviewed source of the ~40% visibility finding
- Google Search Quality Rater Guidelines
Want this done on your site?
Every PalV’s DM engagement starts with a free audit of your actual website — a 12-point
crawl covering what is blocking indexation, on-page gaps against your primary keywords, speed
findings, and the three to five fixes worth making first. Delivered in two working days. No
payment details, and the findings are yours whether you hire us or not.