How to Fix INP (Interaction to Next Paint)
INP measures how long a page takes to visibly respond after a click, tap, or key press. Step-by-step fixes for slow INP scores.

INP measures the time between a user’s click, tap, or key press and the moment the browser visibly updates the page in response — and a page scores “good” at 200 milliseconds or less, measured at the 75th percentile of real visits. Fixing a slow INP score almost always comes down to the same root cause: JavaScript running on the main thread for too long after the interaction starts, blocking the browser from painting a response.
The fix isn’t one setting. It’s a sequence: find which interactions are slow, find what’s blocking the main thread during them, then apply one of four targeted techniques depending on what’s actually causing the delay.
What does INP actually measure?
INP became a Core Web Vital in March 2024, replacing First Input Delay. Where FID only timed the gap before the browser started processing the first interaction, INP times the full cycle for every interaction across a visit: input delay, the time the browser spends running event handlers, and the time until the next frame paints showing a visual response. The worst-performing interaction (with some outliers trimmed) becomes the page’s INP score for that visit.
That’s a meaningfully different thing to optimise than page-load speed. A page can have a fast Largest Contentful Paint and still score poorly on INP if, say, tapping a mobile menu button takes 600 milliseconds to visibly open because a large script is busy running something unrelated at that exact moment.
Step 1: Find which interactions are actually slow
Start with field data, not a single lab test, because INP field scores come from real users on real devices, which are usually slower than the machine used for testing. The Core Web Vitals report in Google Search Console flags URLs or URL groups scoring “needs improvement” or “poor.” For interaction-level detail, Chrome DevTools’ Performance panel records a session and flags individual long interactions, showing which specific script and callback ran during the delay.
Step 2: Break up long JavaScript tasks
A “long task” is any block of JavaScript that runs for more than 50 milliseconds without yielding control back to the browser. During a long task, the browser can’t respond to input or paint an update, no matter how simple the requested change is. The fix is to break large synchronous operations into smaller chunks using scheduler.yield() where supported, or setTimeout(fn, 0) as a fallback, so the browser gets a chance to process the interaction between chunks.
| Symptom | Likely cause | Fix |
|---|---|---|
| Button click feels delayed sitewide | Long JS tasks blocking the main thread | Break tasks into smaller chunks that yield control |
| Slow only on interactions after page load | Heavy hydration or third-party scripts still initialising | Defer non-critical JS, lazy-load below-the-fold widgets |
| Slow specifically on form inputs | Expensive re-renders on every keystroke | Debounce input handlers, memoise re-render logic |
| Visible layout jump after interaction | Synchronous layout recalculation (layout thrash) | Batch DOM reads and writes separately |
Step 3: Cut unnecessary JavaScript, especially from third parties
Ad tags, chat widgets, tag managers, and analytics scripts all compete for the same main thread as a site’s own code. Audit third-party scripts individually rather than assuming they’re all equally costly — some are near-free, others single-handedly own the slowest interaction on a page. Where a script isn’t essential to the interaction a user is trying to complete, defer its load until after the interaction, or load it only when the component it powers actually becomes visible.
Step 4: Avoid large rendering updates on every interaction
Frameworks that re-render more of the DOM than necessary after a state change turn a cheap interaction into an expensive one. Scope state updates narrowly so a click on one component doesn’t trigger a re-render of unrelated parts of the page, and avoid recalculating expensive layout properties (like offsetHeight) inside loops, which forces the browser to recompute layout synchronously on every iteration.
What are the INP score thresholds?
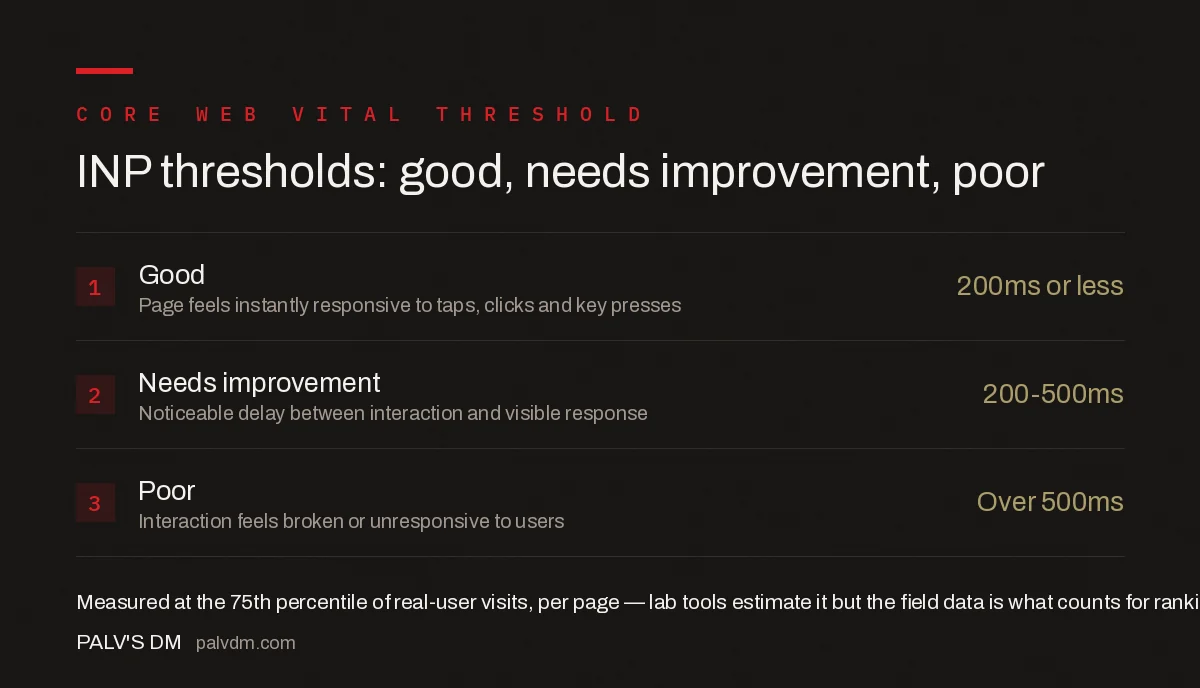
INP thresholds: good, needs improvement, poor
- Good — 200ms or less. Page feels instantly responsive to taps, clicks and key presses.
- Needs improvement — 200-500ms. Noticeable delay between interaction and visible response.
- Poor — Over 500ms. Interaction feels broken or unresponsive to users.
How does your INP compare to the rest of the web?
Better than you probably assume, and that changes how you should prioritise it.
INP became a Core Web Vital on 12 March 2024, replacing First Input Delay. That date matters when reading older benchmarks: FID measured only the delay before the first interaction was handled, while INP captures responsiveness across every interaction in a session. Any pass-rate figure from before that date is describing a materially easier test.
On current data, INP is the vital most sites already clear. The 2025 Web Almanac put mobile INP pass rates at 77% and desktop near 97%. Google’s May 2026 CrUX release reported 86.6% of tracked origins rated good for INP, against 68.6% for LCP.
What that means for your priorities
If your site fails Core Web Vitals overall, INP is statistically not the reason. LCP is. Roughly one origin in seven fails INP; closer to one in three fails LCP.
So the honest sequencing advice is uncomfortable for an article about fixing INP: confirm your LCP is passing before you spend a week breaking up long tasks. Fixing the metric you already pass moves nothing.
There are two exceptions worth naming.
The first is genuinely interactive applications. Population averages are dominated by content pages where the only interaction is a menu tap. If your product is a filterable catalogue, a configurator or a dashboard, your users interact constantly and the aggregate pass rate tells you nothing about your risk.
The second is competitive position. Once LCP is broadly solved across an industry — and CDNs and image pipelines are commoditising exactly that — INP becomes the metric that separates sites still shipping heavy JavaScript from those that are not.
The commercial case is not hypothetical. Indian travel platform redBus reported a 7% increase in sales following a 72% improvement in INP, one of the more frequently cited results in Google’s own performance case studies.
What common mistakes make INP worse, not better?
- Optimising only the interaction that shows up in a single lab test. Field data across many users and devices often surfaces a different, worse interaction than whatever was tested locally on a fast machine.
- Adding a loading spinner instead of fixing the delay. A spinner is a visual paint, so it can technically “pass” INP measurement while the actual task the user wanted still hasn’t happened — this masks the problem rather than fixing it.
- Removing event listeners without checking dependent functionality. Stripping handlers to reduce JS execution can break the very interaction being measured; the goal is faster handlers, not fewer working features.
- Ignoring mobile devices during testing. Mobile CPUs are typically far slower than the desktop machine used to write and test code, and INP is disproportionately worse on mobile as a result.
Common mistakes to check before you start optimising
- Confirm you’re reading field data (real users), not just lab data, before deciding a fix worked.
- Test on a throttled mid-range mobile device, not just desktop Chrome.
- Check whether a third-party script, not first-party code, owns the slowest interaction.
- Re-test after each individual fix rather than bundling several changes into one deploy.
Frequently asked questions
What is a good INP score?
200 milliseconds or less, measured at the 75th percentile of a page’s real-user visits. Between 200ms and 500ms is rated “needs improvement,” and anything above 500ms is “poor” and feels visibly broken to users.
Is INP the same as First Input Delay?
No. First Input Delay only measured the delay before the browser started processing the first interaction. INP measures the full latency of every interaction throughout the visit, including processing time and the time to paint the next visual update, which is why it replaced FID as a Core Web Vital.
Can I measure INP in Chrome DevTools?
Yes, the Performance panel records interactions and flags long ones, and the Web Vitals extension shows INP live as you interact with a page. Lab data is useful for debugging, but the Core Web Vitals report in Search Console uses real-user field data, which is what affects the ranking signal.
Do third-party scripts usually cause slow INP?
Often, yes. Ad tags, chat widgets, and analytics scripts run on the main thread alongside the page’s own code, and a poorly optimised third-party script can single-handedly push INP into “needs improvement” territory even when the site’s own JavaScript is lean.
Sources
- HTTP Archive Web Almanac 2025 — Performance
- web.dev — Interaction to Next Paint (INP)
- Optimize Interaction to Next Paint — web.dev, Google Chrome team
- Core Web Vitals: The Complete Guide
- Technical SEO: The Complete Working Guide
- Third-Party Scripts: Measuring What Each One Costs You
- Lazy Loading Done Right (Without Hurting LCP)
Want this done on your site?
Every PalV’s DM engagement starts with a free audit of your actual website — a 12-point
crawl covering what is blocking indexation, on-page gaps against your primary keywords, speed
findings, and the three to five fixes worth making first. Delivered in two working days. No
payment details, and the findings are yours whether you hire us or not.