Page Speed and Conversion Rate: The Documented Link
The data connecting page speed to conversion rate: how much each second of load time actually costs, and where the drop-off is worst, sourced from real studies.
Every additional second of load time between 0 and 5 seconds costs an average of 4.42% of your conversion rate, based on Portent’s analysis of over 100 million pageviews across B2B and B2C sites. This isn’t a soft correlation people wave around in slide decks. It’s one of the most repeatedly confirmed relationships in web analytics, and most sites still ship pages that ignore it.
The reason this keeps getting treated as a nice-to-have instead of a business problem is that speed feels like an engineering concern, not a revenue one. It’s both. Below is what the actual data says, where the drop-off is steepest, and what that means for prioritizing a fix.
How strong is the link between speed and conversions, really?
Strong enough that multiple independent studies keep landing on the same shape of curve: fast wins big, and the biggest losses happen in the first few seconds, not gradually across the whole range. Ecommerce sites that load in one second post an average conversion rate around 39%, compared to roughly 18% for sites that take six seconds. That’s not a marginal difference. It’s more than double.
Bounce rate tells the same story from the other direction. A two-second delay in load time is associated with a bounce rate increase of over 100%. Visitors don’t wait around to judge your page fairly; they leave and the conversion opportunity disappears with them, before your copy, your offer or your design ever gets evaluated.
Where does the drop actually happen fastest?
The data below is where you should focus first if you’re deciding where to spend limited development time.
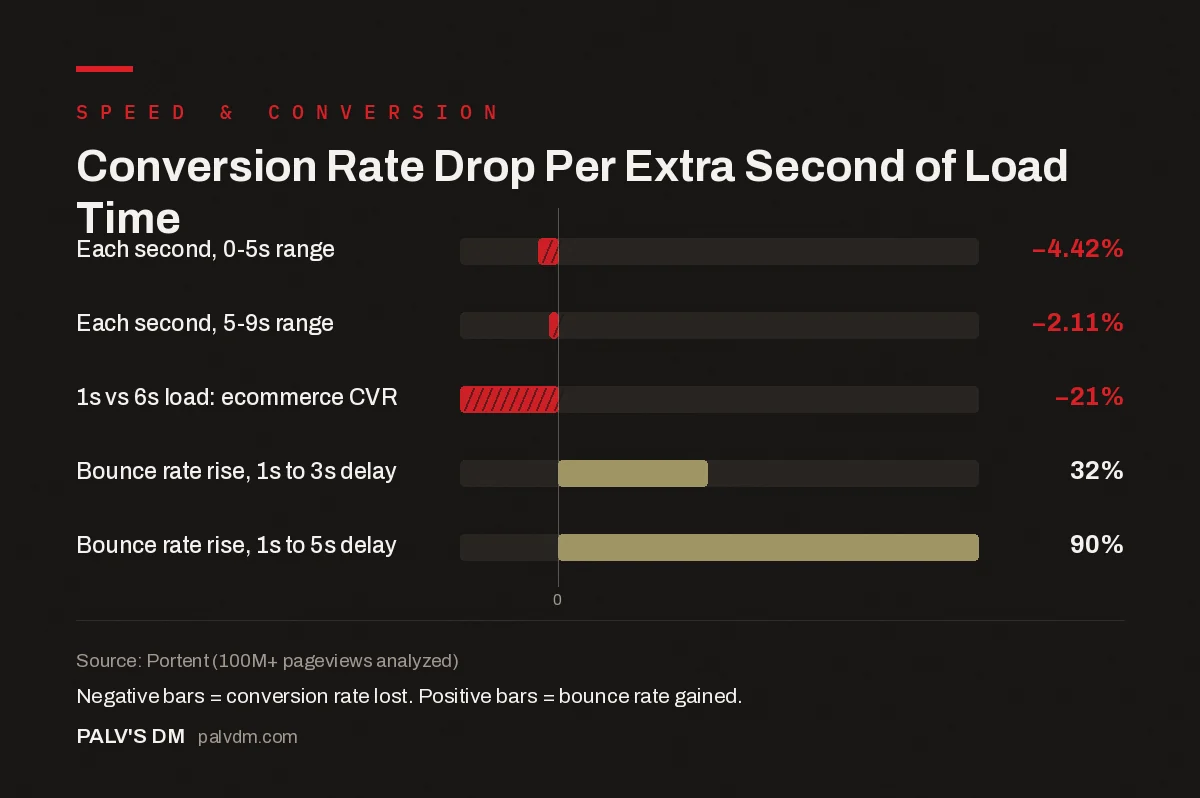
Conversion Rate Drop Per Extra Second of Load Time
| Metric | Value |
|---|---|
| Each second, 0-5s range | -4.42% |
| Each second, 5-9s range | -2.11% |
| 1s vs 6s load: ecommerce CVR | -21% |
| Bounce rate rise, 1s to 3s delay | 32% |
| Bounce rate rise, 1s to 5s delay | 90% |
Source: Portent (100M+ pageviews analyzed)
Notice the shape: the loss per second is worse early (0 to 5 seconds) than it is later (5 to 9 seconds). That has a direct, practical implication. If your site currently loads in 6 to 7 seconds, getting it under 3 seconds is worth dramatically more than shaving a page that’s already at 2 seconds down to 1.5. Prioritize the slowest pages first, not the pages that are already reasonably fast.
Does this apply to lead-generation sites, or just ecommerce?
It applies just as much to service businesses running contact forms and quote requests as it does to online stores. A slow “get a quote” page loses a visitor before they ever see the form, which is functionally identical to losing an ecommerce sale at checkout. The mechanism is the same: impatience compounds with every extra second, and most people never articulate why they left, they just leave.
We see this constantly on service-page audits: a client blames a low form-fill rate on the copy or the offer, when the actual problem is a hero image shipping at four times the resolution the page displays it at, adding two unnecessary seconds before anything else on the page can render.
What’s the actual revenue math on this?
For high-traffic ecommerce sites, the financial impact is large enough to model directly. A one-second delay has been estimated to cost a site doing $100,000 per day roughly $2.5 million in lost sales annually, and every additional 100 milliseconds of load time correlates with roughly a 1% dip in conversions at scale. Even a smaller improvement compounds: a 0.1-second gain in mobile speed has been linked to an 8.4% increase in retail conversions and a 9.2% lift in average order value.
Most businesses reading this aren’t running $100,000-a-day ecommerce operations, and that’s fine. The math scales down proportionally. What doesn’t scale down is the underlying behavior: visitors on a slow mobile connection abandon at similar rates whether your business turns over ten lakh rupees a month or ten crore.
What should you fix first?
- Largest Contentful Paint (LCP). Usually a hero image or a web font blocking render. This is almost always the biggest single lever, and the one visitors notice most directly as “how fast did this feel to load.”
- Unoptimized images. The single most common cause of a slow LCP on the sites we audit. A 4MB PNG hero image serving as a 1200px-wide element is a self-inflicted wound that a proper WebP export fixes in minutes.
- Render-blocking scripts. Third-party trackers, chat widgets and marketing pixels loaded synchronously in the head. Defer or lazy-load anything that isn’t needed to render the first screen.
- Server response time (TTFB). If your hosting itself is slow to respond, no amount of front-end optimization fully compensates. This is where cheap shared hosting quietly taxes every page on the site.
Our Core Web Vitals guide covers how to diagnose and fix LCP, INP and CLS issues specifically, with the exact order we work through them in an audit.
Does speed matter for SEO too, or only conversions?
Both, and they reinforce each other. Core Web Vitals are a confirmed part of Google’s page experience signals, so the same fixes that improve conversion rate also support rankings. This is one of the rare cases in SEO and CRO work where the incentives point in exactly the same direction. There’s no trade-off to negotiate between “fast for Google” and “fast for revenue,” they’re the same project. If you’re weighing competing priorities between SEO fixes and conversion fixes more broadly, our piece on resolving SEO and CRO conflicts covers the cases where the two disciplines actually do pull in different directions.
What does “fast enough” actually look like?
Passing Google’s Core Web Vitals thresholds is a reasonable practical target: Largest Contentful Paint under 2.5 seconds, Interaction to Next Paint under 200 milliseconds, Cumulative Layout Shift under 0.1. Chasing sub-second load times past that point still helps, but the return per hour of engineering time drops off. The 4.42%-per-second figure applies most forcefully in the slow range, on pages currently loading in 4, 6, or 8 seconds. Getting an already-decent 2.8-second page down to 2.2 seconds is worth doing, but it’s not where the big win is sitting.
How do you measure your own baseline before fixing anything?
Don’t start optimizing until you know your actual numbers. Pull your current LCP and page load figures from PageSpeed Insights or the Chrome UX Report for real-user data, not just a lab test run once from a fast connection. Then cross-reference against your analytics: does your bounce rate spike on the pages that test slowest? Does your checkout or form-completion rate dip on mobile specifically? If the correlation is already visible in your own data, that’s your priority list, not a generic checklist copied from a blog post.
A detail that gets missed constantly: lab data (PageSpeed Insights’ simulated score) and field data (real visitors’ actual experience, shown in the Core Web Vitals report inside Search Console) can disagree substantially. A site can score well in the lab and still perform poorly for real users on older phones or patchy mobile networks. Field data is the one that correlates with actual conversion behavior, so that’s the number to trust when prioritizing.
Does this change for JavaScript-heavy sites and single-page apps?
The underlying behavioral finding doesn’t change: visitors still abandon slow experiences at similar rates regardless of what’s causing the delay. What changes is where the bottleneck usually sits. On a heavy JavaScript framework, the visible content might paint quickly while the page stays unresponsive to clicks and taps for another second or two, which shows up as a poor Interaction to Next Paint score rather than a poor LCP. Both cost conversions. Measuring only load time and ignoring interactivity misses half the problem on a JS-heavy build.
Frequently asked questions
How much does one second of load time actually cost in conversions?
Portent’s analysis of over 100 million pageviews found conversion rates drop by an average of 4.42% for each additional second of load time between 0 and 5 seconds, then by a further 2.11% per second between 5 and 9 seconds. The steepest losses happen early, not late.
Is this just an ecommerce problem?
No. Portent’s study covered both B2B and B2C sites, and lead-generation forms are exactly as sensitive to load delay as an ecommerce checkout. A slow contact or quote-request page loses visitors before they ever see the form.
What page speed should I actually aim for?
Aim to pass Google’s Core Web Vitals thresholds, not an arbitrary round number. Practically, getting your Largest Contentful Paint under 2.5 seconds captures most of the conversion benefit; further gains below that point still help, but with diminishing returns.
Does mobile speed matter more than desktop?
Generally yes, because mobile connections are more variable and a larger share of traffic on most sites is mobile. A page that’s fast on an office wifi desktop test can still be slow on a mid-range phone over 4G, which is where most real visitors actually are.
Will fixing page speed alone fix my conversion rate?
No. Speed removes a barrier, it doesn’t create a reason to buy. A fast page with a weak offer or unclear value proposition still converts poorly. Speed is a precondition for conversion optimization to work, not a substitute for it.
Sources
- Site Speed Is (Still) Impacting Your Conversion Rate, Portent
- Web Vitals overview, web.dev / Google
- Core Web Vitals: LCP, INP and CLS Explained Properly
- Mobile Conversion: What Breaks on a 5-Inch Screen
- SEO and CRO in Conflict: Resolving the Common Fights
- Conversion Rate Optimisation for Small Traffic Sites
Want this done on your site?
Every PalV’s DM engagement starts with a free audit of your actual website — a 12-point
crawl covering what is blocking indexation, on-page gaps against your primary keywords, speed
findings, and the three to five fixes worth making first. Delivered in two working days. No
payment details, and the findings are yours whether you hire us or not.
Get your free SEO audit
See Web Development plans and prices