Chat Widgets, Pixels and Tag Managers: The Hidden Speed Bill
Chat widgets, tracking pixels, and tag manager containers each add their own JavaScript payload and main-thread cost. How to measure what each one is actually costing your Core Web Vitals.
Chat widgets, tracking pixels, and tag manager containers each load their own JavaScript, independent of your site’s code, and that JavaScript competes for the same network connections and the same main thread your actual content needs — the bill isn’t the plugin fee, it’s the milliseconds it adds to Largest Contentful Paint and Interaction to Next Paint. None of these tools are inherently disqualifying to use. The problem is that they’re added one at a time, by different teams, over years, and nobody totals the running cost until Core Web Vitals starts failing.
A marketing team adds a chat widget. Sales adds a scheduling embed. Analytics adds three tracking pixels through the tag manager, then a retargeting pixel, then a heatmap tool. Each addition looks harmless in isolation. Stacked, they’re frequently the largest single contributor to a slow page — bigger than the hero image, bigger than the page’s own JavaScript bundle.
Why do third-party widgets cost more than their file size suggests?
The visible cost is network weight — kilobytes downloaded. The real cost is what happens after download: parsing, compiling, and executing that JavaScript on the browser’s main thread, the same thread responsible for responding to clicks, taps, and scrolls. A script that occupies the main thread for a few hundred milliseconds means a tap during that window does nothing until the script releases control — this is exactly what Interaction to Next Paint measures, and third-party embeds are consistently among the top contributors to it.
Chat and support widgets are particularly heavy because many load a full client-side application — not a lightweight button, but a complete UI framework capable of rendering a threaded conversation, file uploads, and a live connection — just to display an icon that most visitors never click. The cost is paid by every visitor whether or not they use the widget.
How do you audit what each script is actually costing you?
- Run a Lighthouse or PageSpeed Insights report and open the third-party section, which groups network and main-thread cost by originating domain rather than by individual request.
- Cross-reference against Chrome DevTools’ Performance panel, filtering the flame chart by domain to see exactly when each script executes relative to your Largest Contentful Paint marker.
- Check whether the script is render-blocking — loaded synchronously in the
<head>withoutasyncordefer— which delays the browser from parsing the rest of the page at all. - Note what each tag inside your tag manager fires on — page load, a specific event, a scroll depth — since a container with dozens of “fire on all pages, on load” tags carries the combined weight of every one of them on every page view.
- Total the cumulative main-thread time across every third-party script, not just the worst offender — five scripts each costing 60ms compound into the same problem as one script costing 300ms.
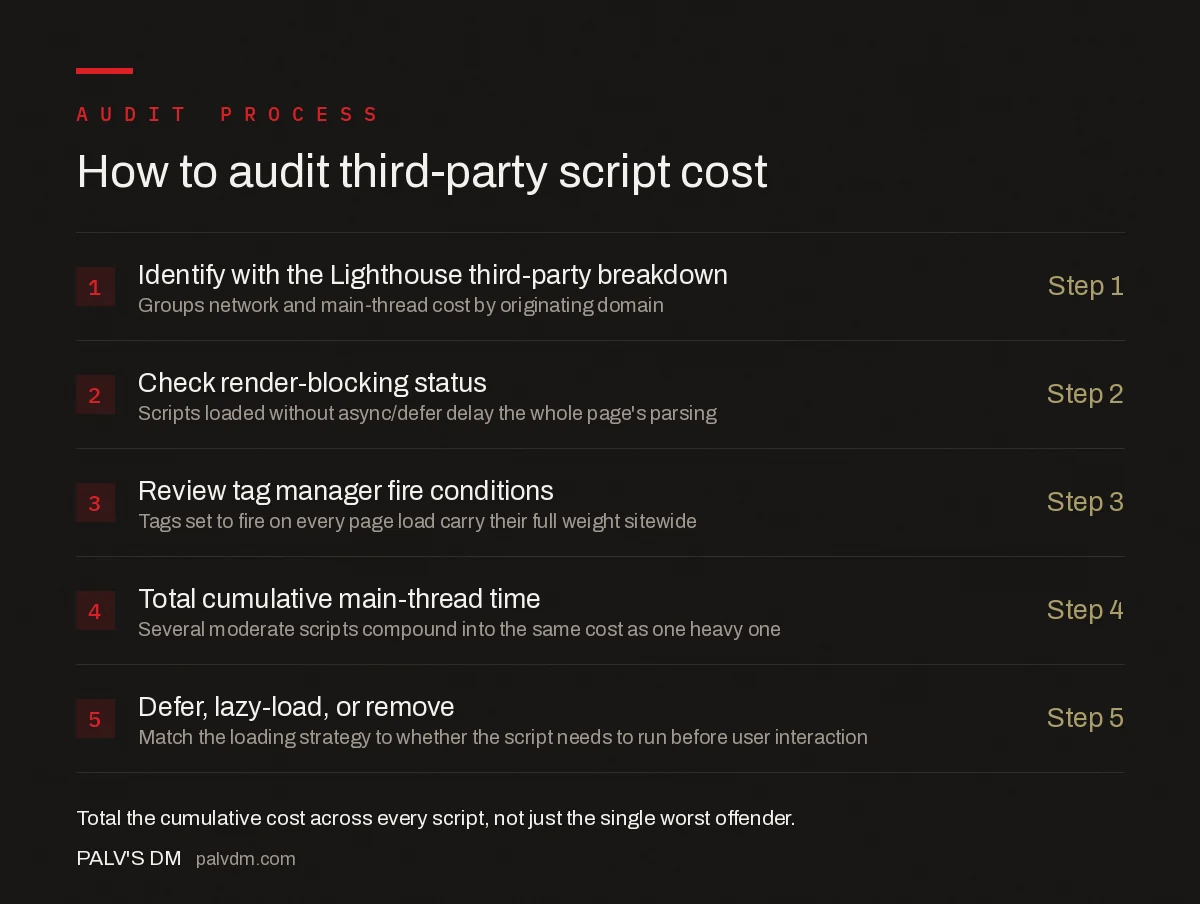
How to audit third-party script cost
- Identify with the Lighthouse third-party breakdown — Step 1. Groups network and main-thread cost by originating domain.
- Check render-blocking status — Step 2. Scripts loaded without async/defer delay the whole page’s parsing.
- Review tag manager fire conditions — Step 3. Tags set to fire on every page load carry their full weight sitewide.
- Total cumulative main-thread time — Step 4. Several moderate scripts compound into the same cost as one heavy one.
- Defer, lazy-load, or remove — Step 5. Match the loading strategy to whether the script needs to run before user interaction.
Which loading strategy fits which type of widget?
| Widget type | Recommended loading strategy | Why |
|---|---|---|
| Chat/support widget | Delay until idle or on user interaction (scroll, time on page) | Most visitors never open it; loading eagerly pays the full cost for a feature most people skip |
| Analytics/tracking pixels | Load via tag manager with async, batch-fire where possible | Doesn’t need to block rendering; data collection tolerates a short delay |
| Tag manager container itself | Load async, high in the head only if a tag genuinely needs early firing | The container is usually light; the tags inside it are the real cost |
| A/B testing or personalisation scripts | Load early and synchronously, but keep the script itself minimal | Must execute before render to avoid flicker, so it needs a different trade-off than the others |
| Heatmap/session-recording tools | Delay until after load, sample rather than run on every visit | Data value doesn’t depend on capturing the very first milliseconds of a session |
What does deferring a widget actually look like in practice?
Three patterns cover most cases. First, an idle callback — requestIdleCallback, or a simple setTimeout as a fallback — that initialises the widget only once the browser has finished more urgent work. Second, an interaction trigger, where the real widget only loads after the user scrolls, moves the mouse, or clicks a lightweight placeholder that looks like the widget button but isn’t yet backed by its JavaScript. Third, a facade pattern: show a static image or CSS-only mockup of the widget immediately, so there’s no visible delay to the user, and swap in the real, fully interactive version behind it once it’s loaded. The facade approach is the most work to implement correctly but produces the best combination of perceived speed and measured Core Web Vitals.
What mistakes make third-party scripts worse than they need to be?
- Loading everything in the
<head>without async or defer. This blocks the browser from parsing the rest of the page until each script finishes downloading and executing. - Duplicate tags left behind after a platform migration. Old analytics or pixel code often survives a redesign because nobody audits the tag manager container when the visible site changes.
- Loading a pixel or widget on every page when it’s only needed on one. A retargeting pixel for a single campaign landing page doesn’t need to fire sitewide.
- No layout reservation for widgets that load late. A chat bubble that pops in after content has settled causes a layout shift, which is exactly what Cumulative Layout Shift penalises.
- Treating the tag manager container as a black box. Because tags can be added by non-developers, containers accumulate tags nobody remembers approving, each with its own fire conditions and weight.
How do you brief a developer to fix this without breaking functionality?
The most common way these fixes stall is a vague instruction like “make the site faster,” which a developer can’t act on without a target. A workable brief names the specific script, the specific metric it’s hurting (LCP, INP, or CLS), and the specific loading strategy requested — for example, “defer the Intercom widget behind a 3-second idle callback or first scroll event, whichever comes first, and reserve 56px of vertical space for the launcher button so it doesn’t shift layout when it mounts.” That’s testable: a before-and-after Lighthouse run against the same URL confirms whether the change worked, and the business functionality (the chat widget still works, just later) stays intact because nothing about the widget’s behaviour changed, only its timing.
How do you decide which widgets are worth the performance cost?
Not every third-party script should be removed — the point isn’t zero widgets, it’s an honest accounting of what each one costs against what it delivers. A chat widget that drives a measurable share of qualified leads is worth a deferred-loading implementation. A heatmap tool nobody has looked at the data from in six months is worth removing outright. The decision changes once you can see the actual main-thread cost next to the actual business value, which is exactly what most sites never do because the two numbers live in different teams’ dashboards.
Frequently asked questions
Do chat widgets slow down a website?
Most chat widgets load their own JavaScript application separately from your site’s code, which adds network requests and main-thread execution time. The effect on Core Web Vitals depends on when and how the script loads, not just its file size — a widget deferred until after page load costs far less than one loaded eagerly.
How do I find out which third-party script is slowing my site?
Open Chrome DevTools Performance panel or a Lighthouse report and look at the “third-party” breakdown, which attributes main-thread blocking time and network weight to each script’s source domain. This shows exactly which widget, pixel, or tag is responsible for the largest share.
Should I remove my tag manager to improve page speed?
Not necessarily. A tag manager container itself is usually lightweight; the cost comes from how many tags are configured to fire on load inside it. Auditing and pruning unused or duplicate tags inside the container usually recovers more speed than removing the container itself.
What is the safest way to load a chat widget without hurting Core Web Vitals?
Delay initialisation until after the main content has loaded, using an idle callback, a scroll or interaction trigger, or a fixed timeout of a few seconds. Show a lightweight static placeholder in its place so the layout doesn’t shift when the real widget finally loads.
Does every tracking pixel need to load on every page?
No. Pixels are frequently left firing sitewide long after the campaign they were added for has ended. Auditing which pixels are still connected to an active campaign or reporting need, and removing the rest, is one of the fastest wins available on a script-heavy site.
Sources
- Third-party JavaScript performance — web.dev, Chrome for Developers
- Core Web Vitals: The Complete Guide
- Technical SEO: The Complete Working Guide
- Third-Party Scripts: Measuring What Each One Costs You
- Finding the LCP Element on Any Page
Want this done on your site?
Every PalV’s DM engagement starts with a free audit of your actual website — a 12-point
crawl covering what is blocking indexation, on-page gaps against your primary keywords, speed
findings, and the three to five fixes worth making first. Delivered in two working days. No
payment details, and the findings are yours whether you hire us or not.