Third-Party Scripts: Measuring What Each One Costs You
Third-party scripts cost you in bytes, main-thread time, and requests. Here's the four-step process to measure each one's real cost before deciding what to cut.

A third-party script’s true cost is measured in three numbers: the kilobytes it downloads, the milliseconds it holds the main thread, and the number of separate requests it triggers — not whether it “feels slow.” Most sites carry five to twenty third-party scripts and have never measured a single one individually; they’ve only measured the page as a whole. Attributing cost per script is what turns “the site feels sluggish” into “this consent banner blocks the main thread for 420ms on mobile, cut it.”
The process below is the same one used in a technical SEO audit: inventory every script, measure its cost in isolation, attribute it to a specific Core Web Vitals metric, then decide what to cut, delay, or replace. Skipping the measurement step and guessing which script is the problem is the single biggest reason performance fixes don’t move the needle.
What determines how much a third-party script actually costs?
Three things, independent of each other. Byte weight is the download size — the script itself plus everything it pulls in afterward, since a 40KB tag manager snippet routinely loads another 300KB of vendor code once it executes. Main-thread time is how long the script’s parsing, compilation, and execution block the browser from responding to anything else, which is the direct driver of Interaction to Next Paint (INP). Request count is how many separate connections the script opens — each one carries DNS lookup, TLS handshake, and round-trip latency that adds up even when individual payloads are small.
A script can be cheap on one axis and expensive on another. A single-pixel tracking beacon is tiny in bytes but can still add 100-200ms of latency on a slow connection. A bundled analytics-plus-heatmap-plus-A/B-testing script can be under 50KB gzipped but burn 300ms+ of main-thread time unpacking and initialising three separate SDKs.
What do you need before you start measuring?
- Chrome DevTools (built into Chrome) — the Performance panel and Network panel do the actual measuring.
- A representative test page — pick the template carrying the most third-party weight (usually the homepage or a high-traffic blog post), not an empty test page.
- Mobile throttling profile — set DevTools to “Slow 4G” and 4x CPU slowdown; desktop-only testing hides most of the real cost.
- Access to Search Console or CrUX data — to confirm the lab findings match what real users on your site actually experience.
- A list of what each script does — ask marketing, sales, and support which tags are load-bearing before you start cutting; measurement tells you cost, not whether a tool is worth keeping.
Step 1: How do you inventory every third-party script on a page?
Open DevTools’ Network panel, reload the page with cache disabled, and sort by domain. Anything not on your own domain is a candidate. Group requests by initiator — a single tag manager often fires ten or more downstream requests, and grouping by the script that triggered them, not just the raw domain list, is what makes the inventory usable. Lighthouse’s report also lists a “Reduce the impact of third-party code” section with every third-party origin already grouped and ranked by blocking time, which is a faster starting point than building the list from the Network panel by hand.
Step 2: How do you measure each script’s byte weight and main-thread cost?
In the Network panel, the Size column gives transferred and resource size per request — sum these per third-party domain for byte weight. For main-thread cost, switch to the Performance panel, record a page load, and enable “Show third-party badges” in the settings. The flame chart then labels each block of script execution by its origin, and the Summary tab at the bottom totals scripting, rendering, and painting time per selection. Select just the third-party blocks and read the total — that number, not the overall page load time, is the script’s real main-thread cost.
Step 3: How do you attribute Core Web Vitals impact to a specific script?
Cross-reference the Performance panel timeline against the LCP, CLS, and INP markers DevTools overlays on the same timeline. A script whose execution block sits before the LCP marker is a candidate for delaying LCP; a script that fires a long task overlapping a user’s first interaction is a candidate for INP damage; a script that injects a DOM element without a reserved size (an ad slot, a cookie banner, a recommendation widget) is a candidate for CLS. Google’s own guidance on loading third-party JavaScript confirms this is the intended diagnostic path — third-party code is treated as a distinct category in performance audits precisely because it behaves differently from first-party code and needs isolating before it can be fixed.
| Loading strategy | When to use it | What it does to the three cost axes |
|---|---|---|
Standard <script src="..."> | Never, for third-party — this blocks parsing | Worst case on all three; parser stops until the script downloads and runs |
async | Scripts with no dependency on DOM order (most analytics) | Downloads in parallel, executes as soon as ready; still costs main-thread time on execution |
defer | Scripts that need the DOM but aren’t urgent | Downloads in parallel, executes after parsing; delays execution but not download |
| Facade / lazy-load on interaction | Chat widgets, video embeds, heavy social embeds | Removes byte weight and main-thread cost entirely until the user actually needs it |
| Self-host a static copy | Fonts, small stable libraries, some analytics beacons | Removes the extra DNS/TLS request cost; you now own patching it |
| Server-side tagging (e.g., Google tag gateway) | High-volume analytics and ad tags | Moves request/processing cost off the browser entirely, onto your own server |
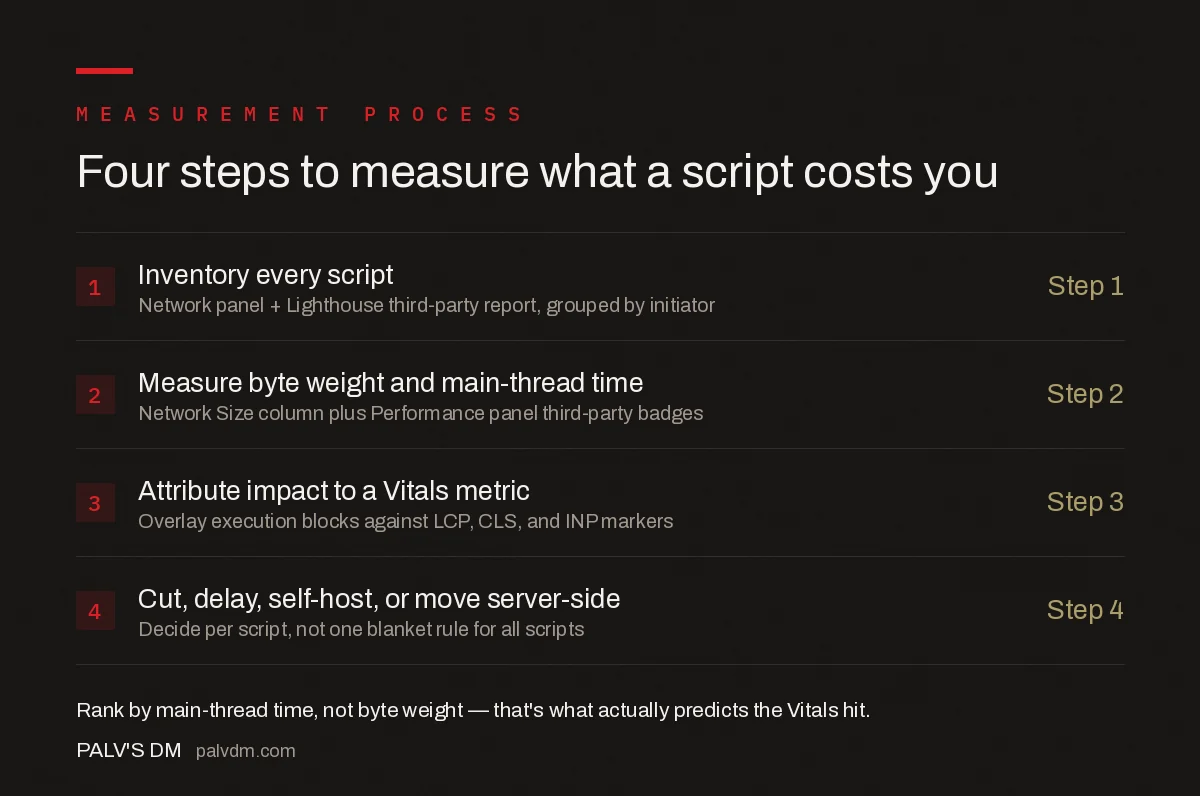
The four-step measurement process
- 1. Inventory every script — Network panel + Lighthouse third-party report, grouped by initiator, not raw domain.
- 2. Measure byte weight and main-thread time — Network panel Size column plus Performance panel third-party badges.
- 3. Attribute the impact to a Vitals metric — overlay execution blocks against the LCP, CLS, and INP markers on the same timeline.
- 4. Decide: cut, delay, self-host, or move server-side — pick the strategy per script, not one blanket rule for all scripts.
Step 4: How do you decide what to cut, delay, or keep?
Rank every script by main-thread cost, not byte weight — a 200KB script that runs once and idles is often cheaper than a 30KB script that re-executes on every scroll event. For each script above your cutoff, ask three questions in order: does removing it break a business function (checkout, support chat, required consent management)? Can it be deferred until after the page is interactive without losing its purpose (most analytics, most heatmaps)? Can it be replaced with a lighter alternative or a server-side equivalent? Scripts that fail all three — heavy, non-essential, and can’t be deferred without breaking — are the ones actually worth spending engineering time to renegotiate with the vendor or remove outright.
What mistakes make this measurement unreliable?
- Testing on desktop only. Mobile CPUs are three to six times slower than desktop; a script that costs 40ms on your laptop can cost 250ms on a mid-range Android phone.
- Testing with an empty cache once and calling it done. Third-party vendors change their payloads without notice — a script that was 60KB last quarter can be 140KB today after a vendor SDK update.
- Blaming the count instead of the cost. Cutting five small, well-deferred scripts while keeping one heavy synchronous one improves the inventory list but not the Vitals scores.
- Ignoring downstream requests. A tag manager showing as one line item in a casual scan can be responsible for a dozen invisible child requests that never get measured.
- Measuring lab data only. Lighthouse and DevTools show one simulated session; CrUX field data shows what the 75th percentile of your actual visitors experience, and the two frequently disagree.
Frequently asked questions
What counts as a third-party script?
Any JavaScript, CSS, font, or image request served from a domain you don’t control: analytics tags, ad networks, chat widgets, A/B testing tools, social embeds, and tag managers. If you can’t push a fix to it through your own deploy pipeline, it’s third-party.
How many third-party scripts is too many?
There’s no fixed number Google publishes, because impact depends on each script’s weight and main-thread cost, not the count. A page with three heavy ad and tag-manager scripts can perform worse than a page running fifteen small, well-deferred ones.
Does Google penalise sites for slow third-party scripts?
Google doesn’t penalise the scripts directly, but Core Web Vitals are a ranking input, and third-party scripts are consistently the largest driver of poor LCP and INP scores on content sites. The performance hit affects rankings indirectly through the Vitals themselves.
Can I just async or defer every third-party script?
No. Async and defer control when a script downloads and executes relative to parsing, but a script that runs late can still block the main thread for hundreds of milliseconds once it fires, hurting INP. Loading strategy and execution cost are separate problems.
What tool gives the most accurate third-party cost breakdown?
Chrome DevTools’ Performance panel with third-party badges enabled gives the most granular per-script breakdown of main-thread time. For field data at scale, PageSpeed Insights and CrUX-backed tools attribute Core Web Vitals impact by origin across real user sessions.
Sources
- Load Third-Party JavaScript — Google for Developers
- Core Web Vitals: The Complete Guide
- Technical SEO: The Complete Working Guide
- Caching Headers Explained: max-age, s-maxage, stale-while-revalidate
- Preload, Preconnect and DNS-Prefetch: Which to Use When
Want this done on your site?
Every PalV’s DM engagement starts with a free audit of your actual website — a 12-point
crawl covering what is blocking indexation, on-page gaps against your primary keywords, speed
findings, and the three to five fixes worth making first. Delivered in two working days. No
payment details, and the findings are yours whether you hire us or not.