Field Data vs Lab Data: Why PageSpeed Shows Two Scores
PageSpeed Insights shows a field data score from real Chrome users and a lab data score from a simulated Lighthouse run, and they often disagree. Here's what each measures and which one Google ranks on.

Field data and lab data are two different measurements PageSpeed Insights shows for the same page: field data is real Chrome users’ actual experience over the past 28 days, and lab data is one simulated Lighthouse run on a fixed device and network — and only field data feeds Google’s Page Experience ranking signal. They disagree often, and the gap isn’t a bug in either measurement; it’s the expected result of comparing thousands of real, messy visits against a single, controlled test.
The confusion usually starts the same way: a developer runs PageSpeed Insights, sees a lab score of 95 and feels confident, then scrolls up and sees the field data section flagging Poor for real users. Both numbers are correct. They’re just answering different questions.
What exactly is field data?
Field data — also called Real User Monitoring or RUM data in performance discussions generally — comes from the Chrome User Experience Report (CrUX), Google’s dataset of anonymized performance metrics from real Chrome users who’ve opted in. It aggregates First Contentful Paint, Largest Contentful Paint, Cumulative Layout Shift, and Interaction to Next Paint over a trailing 28-day window, across every device, network condition, and location those real visitors actually used.
Because it needs a minimum volume of real visits to be statistically meaningful, CrUX doesn’t cover every URL. Low-traffic pages often show origin-level data instead — an aggregate of the whole site — or no field data at all if the page and the origin both fall short of the sample threshold.
What exactly is lab data?
Lab data comes from Lighthouse, Google’s automated auditing tool, which loads the page once in a simulated environment: a mid-tier device profile (currently modeled on a Moto G4-class phone) for mobile, or an emulated desktop with a wired connection for desktop, run from a Google datacenter in North America, Europe, or Asia. It produces the same Core Web Vitals metrics as field data, plus diagnostic detail — a request waterfall, opportunities to trim JavaScript, specific render-blocking resources — that field data can’t provide, because CrUX only reports aggregated numbers, not a breakdown of what caused them.
Field data vs lab data: which one actually matters for rankings?
This is the question that decides how much attention each score deserves.
| Field data (CrUX) | Lab data (Lighthouse) | |
|---|---|---|
| Source | Real Chrome users, opted in | Simulated single run |
| Time window | Trailing 28 days, updated daily in PSI | The moment you run the test |
| Devices/network covered | Every real combination visitors used | One fixed device and network profile |
| Used in Google ranking signal | Yes — this is the Page Experience signal | No — diagnostic only |
| Available for unpublished pages | No — needs real traffic first | Yes — works on any reachable URL |
| Gives root-cause diagnostics | No — aggregate numbers only | Yes — request-level detail and fix suggestions |
Google states this plainly in its own PageSpeed Insights documentation: field data is what feeds the ranking-relevant Page Experience assessment. Lab data never touches rankings directly — its entire purpose is giving developers a controlled, repeatable environment to debug in.
Why do field data and lab data show different numbers for the same page?
Three structural differences explain nearly every mismatch:
- Sample size. Lab data is one run (or a handful, if you re-test); field data is thousands of real sessions averaged and reported at the 75th percentile, which by design captures a worse experience than a typical single test.
- Device and network diversity. The lab simulation uses one throttled profile. Field data spans users on five-year-old Android phones over patchy mobile data alongside people on fiber-connected laptops — the real distribution is wider and skews worse than a controlled mid-tier simulation.
- Geography. Lab tests run from a single Google datacenter region. Field data aggregates users from wherever your actual audience is, and distance from your server measurably affects Time to First Byte and downstream metrics.
How should you use each type of data in practice?
Treat them as two stages of the same workflow rather than competing scores.
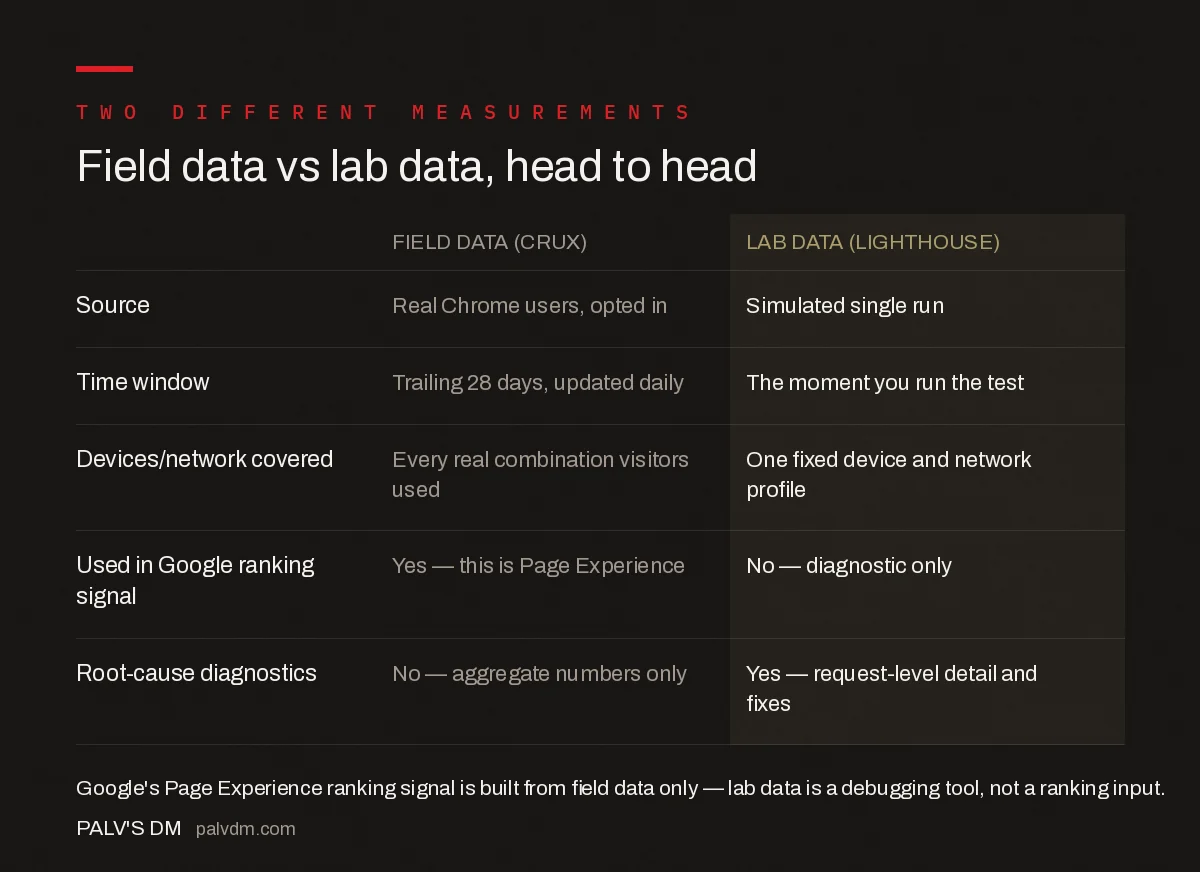
Field data vs lab data at a glance
- Field data (CrUX) — Real users, 28-day window. This is what Google’s Page Experience signal is built from; it can’t be gamed by a single fast test run.
- Lab data (Lighthouse) — Simulated, single run. Use it to debug specific issues and verify a fix worked before waiting weeks for field data to catch up.
The practical sequence: use lab data during development to find and fix specific bottlenecks — a render-blocking script, an oversized hero image, unoptimized fonts. Ship the fix, then wait for field data to confirm it moved the real-user numbers, since that’s the only score Google’s ranking systems actually consult. A page can pass every lab audit and still fail its Core Web Vitals assessment if the real-world distribution of devices and networks tells a different story.
What are the official Core Web Vitals thresholds?
Both field and lab data get classified against the same thresholds, aligned with the Web Vitals initiative:
| Metric | Good | Needs Improvement | Poor |
|---|---|---|---|
| LCP (Largest Contentful Paint) | 0–2,500ms | 2,500–4,000ms | over 4,000ms |
| INP (Interaction to Next Paint) | 0–200ms | 200–500ms | over 500ms |
| CLS (Cumulative Layout Shift) | 0–0.1 | 0.1–0.25 | over 0.25 |
| FCP (First Contentful Paint) | 0–1,800ms | 1,800–3,000ms | over 3,000ms |
| TTFB (experimental) | 0–800ms | 800–1,800ms | over 1,800ms |
A page or origin passes the overall Core Web Vitals assessment only when the 75th percentile of LCP, INP, and CLS field data all fall in the Good range simultaneously. One metric slipping into Needs Improvement fails the whole assessment, regardless of how the other two score.
Frequently asked questions
What is the difference between field data and lab data in PageSpeed Insights?
Field data is real-world performance data collected from actual Chrome users over the trailing 28 days, via the Chrome User Experience Report (CrUX). Lab data is generated by running Lighthouse against a simulated device and network in a controlled environment at the moment you test.
Which one does Google use for ranking, field data or lab data?
Google’s Page Experience ranking signal uses field data from the Chrome User Experience Report, not lab data. Lab data is a diagnostic tool for developers; it has no direct role in how Core Web Vitals are assessed for ranking purposes.
Why does my lab score look great but field data shows Poor?
Lab data reflects one simulated run on a mid-tier device and fixed network. Field data reflects thousands of real visits on a mix of devices, network speeds, and geographies over 28 days, including ones far slower than the lab simulation, which pulls the real-world score down.
Why does a page show no field data at all?
CrUX requires a minimum number of distinct real-user samples over the 28-day window and the page must be public, crawlable, and indexable. New pages or very low-traffic pages often fall back to origin-level data or show no field data until enough visits accumulate.
Should I optimize based on lab data or field data?
Use lab data to debug and iterate quickly since it’s available on demand for any page, including ones not yet live. Use field data as the final check, since it’s what Google actually uses for ranking and reflects real conditions lab testing can’t fully replicate.
Sources
- About PageSpeed Insights — Google for Developers
- Core Web Vitals: The Complete Guide
- Technical SEO: The Complete Working Guide
- Finding the LCP Element on Any Page
- Reducing Main-Thread Work for a Better INP
Want this done on your site?
Every PalV’s DM engagement starts with a free audit of your actual website — a 12-point
crawl covering what is blocking indexation, on-page gaps against your primary keywords, speed
findings, and the three to five fixes worth making first. Delivered in two working days. No
payment details, and the findings are yours whether you hire us or not.