Server Response Time and TTFB: Diagnosing the Real Cause
TTFB under 0.8 seconds is Google's rough guide for good. The six-step diagnostic process for finding what's actually slow — hosting, a missing CDN, uncached queries, or redirects — instead of guessing.

Server response time and TTFB (Time to First Byte) measure the delay between a browser requesting a page and the first byte of the response arriving — Google’s rough guide is 0.8 seconds or less at the 75th percentile of real users for a good score, 0.8 to 1.8 seconds needs improvement, and anything past 1.8 seconds is poor. The real work isn’t hitting that number, it’s finding what’s actually causing the delay: a database query, a missing CDN, a redirect chain, or hosting that’s simply undersized for the traffic it gets. Guessing wastes time; the diagnostic sequence below finds the real cause in under an hour on most sites.
TTFB isn’t a Core Web Vitals metric itself, but it precedes every metric that is. Largest Contentful Paint can’t start rendering until the first byte arrives, so a slow TTFB puts a floor under LCP that no amount of image compression or font optimisation can get past. On sites with thousands of pages, a slow TTFB also eats into Googlebot’s crawl budget, since Google throttles crawl rate on servers that respond slowly or inconsistently.
What counts as a good TTFB score?
Google’s Chrome team publishes the same thresholds used across PageSpeed Insights and the Chrome UX Report (CrUX):
| TTFB (75th percentile) | Rating | What it means |
|---|---|---|
| ≤ 0.8 seconds | Good | Server response isn’t holding back FCP or LCP |
| 0.8 – 1.8 seconds | Needs improvement | Usually fixable with caching, a CDN, or query optimisation |
| > 1.8 seconds | Poor | Backend or hosting is very likely the primary bottleneck |
Lighthouse applies a stricter 600ms threshold in its own server-response-time audit, but that audit measures a narrower slice — it excludes DNS lookup and redirect time, both of which field TTFB includes. That gap is exactly why a page can pass Lighthouse’s server response check and still show a poor field TTFB in PageSpeed Insights: the difference is redirects and DNS, not the backend itself.
Step 1: Measure TTFB with field data before touching anything
Start in PageSpeed Insights, not DevTools. The “Discover what your real users are experiencing” section at the top reports field TTFB pulled from the Chrome User Experience Report — actual visits, not a single simulated load. Lab tools test the final URL under one fixed network condition, so they routinely miss the redirect chains, cold caches, and geographic latency that real visitors hit. If a site gets meaningful CrUX traffic, field data is the number to trust; lab data is for drilling into why that number is what it is.
Step 2: Break down backend time with the Server-Timing header
Once field data confirms a problem, the Server-Timing response header turns one opaque number into a breakdown. Set it from the backend with a duration and description for each process worth measuring — database queries, server-side rendering, disk reads, or a CDN cache hit/miss:
Server-Timing: db;desc="Database";dur=121.3, ssr;desc="Server-side Rendering";dur=212.2Chrome DevTools’ Network panel shows these values per request under the Timing tab, and the same data populates the serverTiming property on the Navigation Timing API for field measurement in production. This is the single fastest way to stop guessing whether it’s the database, the rendering step, or the CDN that’s slow — the header tells you directly.
Step 3: Rule out redirects as the hidden cause
A redirect adds a full round trip before the browser even reaches the page that will respond with content, and a chain of two or three redirects compounds that delay. Same-origin redirects are the ones worth fixing first, since they’re entirely under a site’s control — check for missing https:// in internal links (which forces an HTTP-to-HTTPS redirect), and inconsistent trailing slashes across templates. An HSTS header, once in place, removes the HTTP-to-HTTPS redirect entirely for repeat visitors by telling the browser to request HTTPS directly on every future visit.
Step 4: Separate a caching problem from a hosting problem
If lab TTFB is much lower than field TTFB, the gap is usually caching or network distance, not raw server capacity — test an uncached URL (a rarely visited page, or the same page with a cache-busting query parameter) to see the real uncached response time. If lab and field TTFB are both consistently high, the problem is more likely the origin server itself: insufficient memory causing the application to thrash, an outdated backend stack, or shared hosting that’s undersized for the traffic. These two situations call for different fixes, and treating a hosting problem as a caching problem (or the reverse) burns time without moving the number.
Step 5: Add a CDN and cache what can be cached
A content delivery network solves the part of TTFB that better code can’t: physical distance between the visitor and the origin server. Edge servers cache content closer to visitors, and most CDN providers also bring faster DNS resolution and modern TLS 1.3 handshakes, which shortens connection-setup time on top of the caching benefit. Configure Cache-Control headers so static and semi-static content serves from the edge instead of round-tripping to origin on every request — even a short cache window meaningfully reduces average TTFB on busy pages, since only the first visitor in that window pays the full origin latency.
Step 6: Stream markup and consider 103 Early Hints
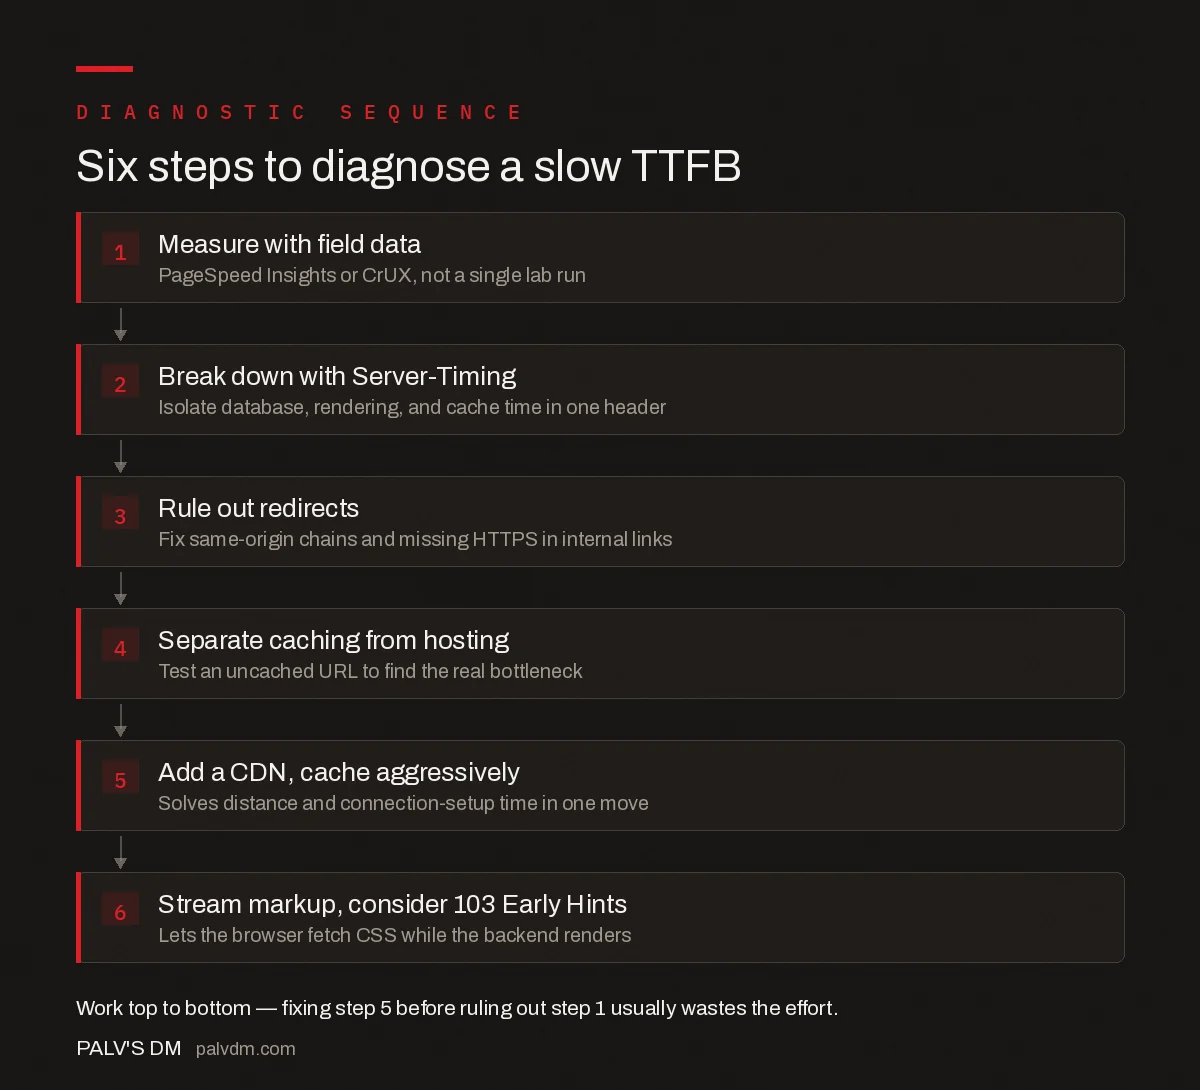
The six-step TTFB diagnostic sequence
- Measure with field data. Use PageSpeed Insights or CrUX before trusting a single lab result.
- Break down with Server-Timing. Isolate database, rendering, and cache time in one header.
- Rule out redirects. Fix same-origin chains and missing HTTPS in internal links first.
- Separate caching from hosting. Test an uncached URL to know which one is the real bottleneck.
- Add a CDN and cache aggressively. Solves distance and connection-setup time in one move.
- Stream markup; consider 103 Early Hints. Lets the browser start fetching CSS while the backend still renders.
Browsers process markup as it streams in, parsing chunks incrementally rather than waiting for the full response — so a backend that flushes HTML progressively, instead of assembling the entire page before sending anything, gets useful content to the browser sooner even without lowering total generation time. Where the backend genuinely can’t respond faster, the 103 Early Hints status code lets the server tell the browser about render-critical resources like CSS while it’s still preparing the main response, so those resources start downloading in parallel instead of queuing behind it.
What mistakes make TTFB fixes fail?
- Optimising images and fonts before checking TTFB. If the backend takes 1.5 seconds to respond, no amount of frontend work touches that floor — diagnose the backend first.
- Trusting a single Lighthouse run. One lab test misses caching effects, redirect chains, and the network variance real visitors experience; field data catches what lab data hides.
- Adding a CDN without fixing the origin. A CDN caches what it can, but every cache miss still round-trips to a slow origin server, so the underlying problem resurfaces on any uncached page.
- Caching so aggressively that stale content ships. Long cache windows help TTFB but need a clear invalidation path, or content updates silently stop reaching visitors.
- Ignoring shared hosting limits. Shared hosting is fine for small static sites; a growing site with database queries and personalisation usually outgrows it well before TTFB numbers suggest a code problem.
Frequently asked questions
What is a good TTFB score?
Google’s rough guide is 0.8 seconds or less at the 75th percentile of real users, measured as good; 0.8 to 1.8 seconds needs improvement; anything above 1.8 seconds is poor. TTFB isn’t itself a Core Web Vitals metric, but it sets the floor for Largest Contentful Paint, so a slow TTFB drags LCP down with it.
Does TTFB directly affect Google rankings?
Not directly — TTFB isn’t a ranking factor on its own. It matters because it’s the floor every other loading metric sits on top of, including Largest Contentful Paint, which is a Core Web Vitals signal Google does use. A slow TTFB also reduces how much Googlebot can crawl within its allotted time on large sites.
Why is my lab TTFB different from my field TTFB?
Lab tools like Lighthouse usually test the final URL with no real-world network variance, which can hide redirect chains and caching effects that field users experience. If field TTFB (from PageSpeed Insights or CrUX) is much higher than lab TTFB, look at redirects, server-side caching gaps, and geographic distance to the origin server first.
Will a CDN fix a slow TTFB on its own?
Often, but not automatically. A CDN cuts the physical distance data travels and usually brings faster DNS and modern TLS, which lowers connection-setup time. It does not fix slow database queries or an underpowered origin server — those still show up in TTFB whenever the CDN has to fetch fresh content from the origin.
What is Server-Timing and why does it help diagnose TTFB?
Server-Timing is an HTTP response header your backend sets to report how long individual processes — a database query, server-side rendering, a cache lookup — took to run. It turns TTFB from one opaque number into a breakdown you can see in Chrome DevTools, showing exactly which backend step is slow.
Sources
- Optimize Time to First Byte — web.dev, Google Chrome team
- Time to First Byte (TTFB) — web.dev, Google Chrome team
- Core Web Vitals: The Complete Guide
- Technical SEO: The Complete Working Guide
- Field Data vs Lab Data: Why PageSpeed Shows Two Scores
- How to Fix a Poor LCP Score, Step by Step
- Critical CSS: Extracting It Without Breaking Layout
Want this done on your site?
Every PalV’s DM engagement starts with a free audit of your actual website — a 12-point
crawl covering what is blocking indexation, on-page gaps against your primary keywords, speed
findings, and the three to five fixes worth making first. Delivered in two working days. No
payment details, and the findings are yours whether you hire us or not.