How to Fix a Poor LCP Score, Step by Step
A poor LCP score almost always comes down to one of four sub-parts: slow server response, render-blocking resources, slow resource load time, or render delay. Here is how to diagnose and fix each one.

A poor LCP score is almost always caused by one of four sub-parts of the loading timeline: a slow server response, render-blocking CSS or JavaScript, a slow-loading LCP resource itself, or a render delay after the resource has arrived — and fixing it means measuring which sub-part is actually the bottleneck before changing anything. Guessing at a fix without that diagnosis step is the most common reason LCP work doesn’t move the score: teams optimise images when the real problem was a 1.2-second server response time, or the reverse.
Largest Contentful Paint measures how long it takes the largest image or text block in the viewport to render, from the moment the page starts loading. Google’s target is 2.5 seconds or less at the 75th percentile of real-user visits — meaning three out of four visits need to hit that mark, not just your fastest test run in DevTools.
What counts as a good LCP score?
Google splits LCP into three bands, measured at the 75th percentile of real-user page loads across both mobile and desktop:
| LCP time | Rating | What it means |
|---|---|---|
| 0 – 2.5s | Good | Meets the Core Web Vitals threshold; no action needed |
| 2.5s – 4.0s | Needs improvement | Passable but leaves ranking and UX value on the table |
| 4.0s+ | Poor | Fails the threshold; prioritise a fix |
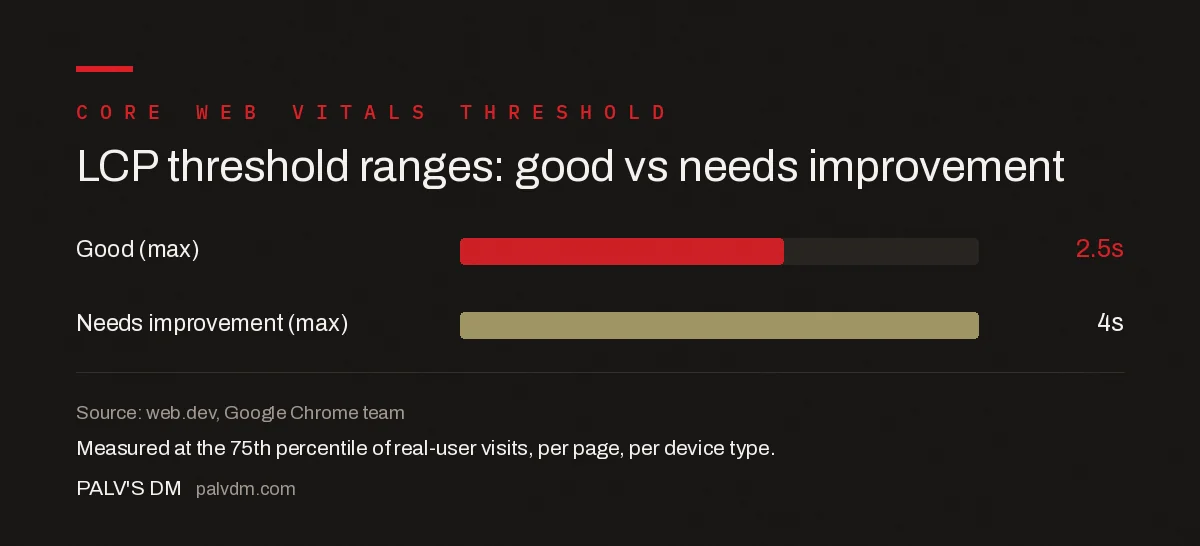
LCP threshold ranges
- Good (max): 2.5 seconds
- Needs improvement (max): 4.0 seconds
- Measured at the 75th percentile of real-user visits, per page, per device type.
How do you find which element Google is measuring?
Before fixing anything, confirm which specific element is your LCP element — it’s frequently not the element you’d guess. Run the URL through PageSpeed Insights or open Chrome DevTools’ Lighthouse panel and check the Diagnostics section for the “Largest Contentful Paint element” audit; it names the exact image, background image, or text block. DevTools’ Performance panel trace also flags the LCP marker directly on the timeline, which is useful when the page has multiple large elements competing for the viewport.
How do you diagnose which sub-part is slowing LCP down?
LCP time breaks into four sequential sub-parts, and the waterfall in PageSpeed Insights’ diagnostics shows the duration of each. The longest one is where to focus first.
Step 1: Check Time to First Byte (TTFB)
If the server itself is slow to respond, everything downstream is delayed before the browser has anything to render. A TTFB above roughly 600ms on a repeat basis points to server-side latency: uncached dynamic pages, an overloaded database query, or a hosting plan that’s undersized for the traffic.
Step 2: Check for render-blocking resources
CSS and synchronous JavaScript loaded in the <head> block the browser from painting anything until they finish downloading and executing. Inline critical, above-the-fold CSS directly in the HTML and defer or async everything else.
Step 3: Check resource load time for the LCP element itself
If the LCP element is an image, its own file size and delivery path matter directly. Oversized, unoptimised, or poorly compressed images add seconds on a slow connection; serving modern formats (WebP, AVIF) at the actual display size fixes this reliably.
Step 4: Check render delay after the resource loads
Sometimes the resource arrives quickly but the browser is still busy with other JavaScript execution before it paints the element. Reducing main-thread work and third-party script execution during initial load closes this gap.
What specific fixes move LCP the most?
- Preload the LCP resource. Add
<link rel="preload">for the hero image or LCP font so the browser starts fetching it immediately instead of discovering it mid-render. - Never lazy-load the LCP image. Lazy-loading defers exactly the request LCP is timing; the LCP element should load eagerly, not with
loading="lazy". - Set explicit width and height attributes. This doesn’t speed up LCP directly but prevents layout shifts that can delay the final paint of the element into view.
- Move to server-side or static rendering for the above-the-fold content. Client-side rendered pages often can’t paint the LCP element until JavaScript has executed and fetched data, adding a render delay that server-rendered HTML avoids.
- Use a CDN to cut network round-trip time. Especially relevant if your audience is geographically distant from your origin server, since it directly reduces TTFB.
- Compress and correctly size images. A hero image served at 4x the display resolution is a common, easily fixed cause of a slow LCP resource load.
What mistakes make an LCP fix not work?
Fixing the wrong sub-part is the most common failure — compressing images when TTFB was the actual bottleneck won’t move the score. Preloading too many resources at once dilutes the priority signal the browser needs to fetch the real LCP element first. And testing only in a fast lab environment (a developer’s fibre connection and a new laptop) hides problems that show up clearly in the field data from real, slower mobile connections — which is what Google actually scores against.
How do you confirm the fix worked?
Lab data from PageSpeed Insights or Lighthouse shows the effect of a change immediately, but field data — the real-user data Google uses for ranking — takes up to 28 days to fully refresh in the Chrome UX Report and Search Console’s Core Web Vitals report. Treat a lab improvement as a good sign, then confirm it in field data before considering the fix complete.
Frequently asked questions
What is a good LCP score?
A good LCP is 2.5 seconds or less, measured at the 75th percentile of real-user page visits, whether on mobile or desktop. Between 2.5 and 4.0 seconds is classed as needs improvement, and anything above 4.0 seconds is poor.
How do I find out which element is my LCP element?
Run the page through PageSpeed Insights or Chrome DevTools’ Lighthouse panel and open the Diagnostics section for the Largest Contentful Paint element audit, which names the exact image or text block Google measured. Chrome DevTools’ Performance panel also highlights it directly in a trace.
Does lazy-loading my LCP image help or hurt?
It hurts. Lazy-loading defers the image request until the browser confirms the image is in the viewport, which delays exactly the resource LCP is measuring. The LCP image should load eagerly and, ideally, be preloaded.
Can a font file be the reason LCP is poor?
Yes, if the LCP element is a text block using a custom web font and the font blocks rendering until it loads. Preloading the font file, or using font-display: swap so system fonts render first, removes this as an LCP bottleneck.
Is LCP the same on mobile and desktop?
No, they’re measured and reported separately, and mobile scores are typically worse because of slower network conditions and less processing power. Google’s Core Web Vitals report in Search Console splits mobile and desktop data, and both need to meet the 2.5-second threshold independently.
Sources
- Optimize Largest Contentful Paint — web.dev
- Core Web Vitals: The Complete Guide
- Technical SEO: The Complete Working Guide
- Image Dimensions and CLS: The Two-Attribute Fix
- Reducing Main-Thread Work for a Better INP
- Image Optimisation for Speed and Search
Want this done on your site?
Every PalV’s DM engagement starts with a free audit of your actual website — a 12-point
crawl covering what is blocking indexation, on-page gaps against your primary keywords, speed
findings, and the three to five fixes worth making first. Delivered in two working days. No
payment details, and the findings are yours whether you hire us or not.