Finding the LCP Element on Any Page
The LCP element is whichever image, text block, or video fills the most viewport space when it finishes rendering. How to identify it in Chrome DevTools and PageSpeed Insights, and what to do once you know.

The LCP element is whichever image, block of text, or video occupies the largest area of the viewport at the moment it finishes rendering — find it in Chrome DevTools’ Performance panel by recording a page load and hovering the LCP marker, or in PageSpeed Insights under Diagnostics by expanding “Largest Contentful Paint element.” Google considers 2.5 seconds or faster good, measured at the 75th percentile of real visits; 2.5 to 4 seconds needs improvement; anything slower is poor. Once you know which element it is, the fix depends entirely on what kind of element it turns out to be.
Teams often optimise the wrong thing because they assume the LCP element is whatever loads first, or whatever’s at the very top of the page. It’s neither. It’s whatever is biggest once painted, and on a lot of pages that turns out to be a background image behind a headline, or a hero video poster frame nobody thought to check.
What is the LCP element?
Largest Contentful Paint is one of Google’s three Core Web Vitals, and it measures loading performance from the user’s perspective: how long it takes for the largest visible content element to render. The “element” part is specific — the browser tracks every image, text node, and video poster in the initial viewport, compares their rendered sizes, and reports the biggest one as the LCP candidate. Elements added after scroll, or outside the initial viewport, don’t count toward LCP even if they’re visually larger once revealed.
Common LCP elements include hero images, large headline text blocks rendered with a custom web font, background images set via CSS, and video poster frames. On text-heavy pages with no large hero image, a large heading or intro paragraph can end up as the LCP element instead.
What counts as a good LCP score?
Google’s thresholds are based on real-user field data from the Chrome User Experience Report (CrUX), aggregated at the 75th percentile over a rolling 28-day window — meaning at least 75% of visits to a page need to hit the threshold for it to count as “good.”
| LCP time | Rating | What it means |
|---|---|---|
| ≤ 2.5 seconds | Good | Meets Google’s Core Web Vitals threshold at the 75th percentile |
| 2.5 – 4.0 seconds | Needs improvement | Borderline; often fixable with straightforward image or server changes |
| > 4.0 seconds | Poor | Likely to affect both user experience and Core Web Vitals assessment |
Lab tools like Lighthouse and PageSpeed Insights’ lab section simulate a single load under controlled conditions, which is useful for debugging but doesn’t always match field data — worth understanding the gap between field data and lab data before treating a single Lighthouse score as the full picture.
How do you identify the LCP element step by step?
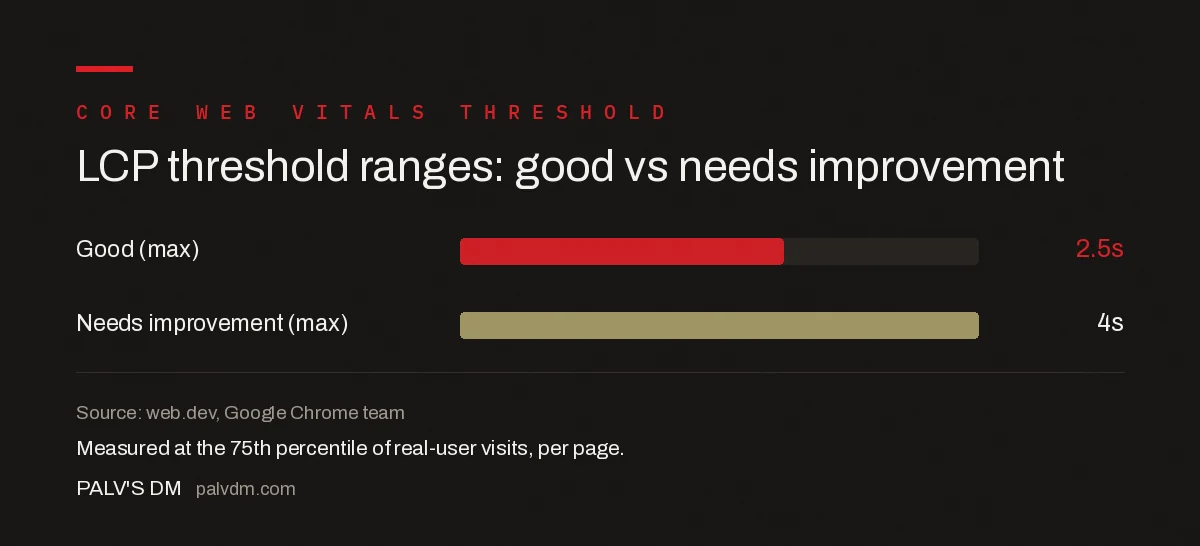
LCP threshold ranges
| Metric | Value |
|---|---|
| Good | ≤ 2.5s |
| Needs improvement | 2.5s – 4.0s |
| Poor | > 4.0s |
Source: web.dev, Google Chrome team
To confirm which element it actually is on a specific page, use either of these two methods, both free and built into tools most teams already have:
- Chrome DevTools Performance panel — Open DevTools, go to Performance, click Record, reload the page fully, then stop. Locate the LCP marker on the timings track and hover it to see the exact element and its four sub-phase timings (TTFB, load delay, load time, render delay).
- PageSpeed Insights Diagnostics — Run the URL through PageSpeed Insights, scroll to Diagnostics, and expand “Largest Contentful Paint element.” It shows the exact HTML node along with which sub-phase is consuming the most time.
What is the LCP element on most pages?
An image, overwhelmingly. Which is why knowing how to identify yours matters more than it might sound.
Web Almanac analysis has consistently found images to be the LCP element on roughly 73% of mobile pages and around 83% on desktop. Text blocks make up most of the remainder, usually a heading or hero paragraph on pages with no large image above the fold.
Among those image LCP elements, the format distribution is still dominated by legacy files: in the 2025 dataset, JPG accounted for 57% on desktop and PNG for 26%, with WebP at 11% and AVIF at 0.7%.
There is a second variable that is easy to overlook. The 2025 Almanac found the LCP image was served from the same host as the page for only 51% of desktop pages and 44% on mobile. Cross-origin images pay for a fresh DNS lookup, TCP connection and TLS handshake before a single byte of image data moves — delay that lands squarely in the resource load delay phase, before the download you are trying to optimise even begins.
Why the population data is useful to you
Three predictions you can make before opening DevTools.
Your LCP element is probably an image. If your page has a hero, that is your first suspect and you will usually be right.
It is probably a JPG or PNG. Converting the single LCP image to WebP or AVIF is often a larger win than converting your entire library, because it is the one file sitting on the critical path.
It might be on a different domain than you think. Media libraries pushed to a CDN subdomain, product images on a DAM, hero images pulled from a page builder’s asset host — each adds connection overhead the waterfall will show and the score will not explain.
None of this replaces measuring your own page. It tells you what to check first, and the threshold worth holding onto is unchanged: 2.5 seconds for a good LCP, measured at the 75th percentile of real visits.
What should you do once you know the LCP element?
The fix depends on what the element is and why it’s slow, which is exactly why identifying it correctly matters more than guessing. An unoptimised hero image usually needs compression, a modern format like WebP or AVIF, and a fetchpriority="high" attribute so the browser fetches it before lower-priority resources. A large text block rendered in a custom web font needs the font preloaded or swapped with font-display: swap so text isn’t invisible while the font downloads. A background image set via CSS needs to be preloaded explicitly, since browsers discover CSS background images later in the loading sequence than they discover <img> tags.
Server response time also factors in — the first sub-phase DevTools reports, Time to First Byte, is often the real bottleneck on slow hosting, which is one of the reasons hosting choice affects SEO even when the visible content on the page hasn’t changed at all. If TTFB alone accounts for over a second of the LCP time, no amount of image optimisation on the frontend closes that gap.
Does a CDN help fix LCP?
Often, but not automatically. A content delivery network reduces the physical distance data has to travel, which cuts server response time for visitors far from the origin server, and most CDNs also handle image resizing and modern format conversion on the fly. But CDNs help and hurt SEO in different situations depending on configuration — a misconfigured cache policy that serves stale, unoptimised images defeats the purpose, and a CDN alone doesn’t fix a bloated, unpreloaded LCP element sitting behind a slow-loading web font.
Frequently asked questions
What is the LCP element?
The LCP element is the single largest image, text block, or video visible in the viewport at the moment it finishes rendering during page load. It’s usually a hero image, a large heading, or a background image — whichever one occupies the most pixels when the browser paints it.
What LCP time counts as good?
Google considers an LCP of 2.5 seconds or faster, measured at the 75th percentile of real-user visits, to be good. Between 2.5 and 4 seconds needs improvement, and anything above 4 seconds is classified as poor.
How do I find the LCP element in Chrome DevTools?
Open DevTools, go to the Performance panel, click Record, reload the page, then stop recording. Find the LCP marker on the timings track and hover it — it shows the exact element and a breakdown of the time spent in each loading sub-phase.
Can the LCP element change between page loads?
Yes. If a page uses a carousel, lazy-loaded ads, or content that shifts based on connection speed, a different element can qualify as largest on different loads. Checking LCP across a few reloads, and across both mobile and desktop viewports, catches this before it causes confusing field data.
Why does PageSpeed Insights show a different LCP than what I see load first?
PageSpeed Insights measures the largest element, not the first one to appear. A small logo can render instantly while a large hero image still loading afterward is the true LCP element, since it occupies far more viewport space once it finishes painting.
Sources
- HTTP Archive Web Almanac 2025 — Performance
- HTTP Archive Web Almanac 2024 — Performance (LCP element types)
- Largest Contentful Paint (LCP) — web.dev, Google Chrome team
- Largest Contentful Paint diagnostic — Chrome for Developers
- Core Web Vitals: The Complete Guide
- Technical SEO: The Complete Working Guide
Want this done on your site?
Every PalV’s DM engagement starts with a free audit of your actual website — a 12-point
crawl covering what is blocking indexation, on-page gaps against your primary keywords, speed
findings, and the three to five fixes worth making first. Delivered in two working days. No
payment details, and the findings are yours whether you hire us or not.