Reading Update Damage by Page, Query, Device and Country
Site-wide traffic figures never diagnose a core update. How to segment the loss by page type, query cluster, device and country to find the real cause.

A site-wide traffic figure never diagnoses a core update. The diagnosis lives in the shape of the loss — which page types, which query clusters, which devices and which countries moved — because a loss concentrated in one segment names a cause, while a loss spread evenly across all of them usually means the update was not responsible at all. Segmenting takes about an hour in Search Console and replaces speculation with a specific, testable statement such as “product category pages lost 38 per cent of clicks on informational queries in India, while transactional queries held”.
The order matters as much as the dimensions. Segment before you form a hypothesis, not after, because looking for evidence of an idea you already have is how a caching bug spends three weeks disguised as an algorithm update.
Why does an aggregate figure hide the diagnosis?
Because core updates reassess relevance and quality query by query, which is inherently uneven. Different pages on your site compete against different fields, so a reassessment moves them differently. Aggregate figures average those opposing movements into one number that describes no page in particular.
Uniformity is itself a signal. A change that flattens every template, every query type and every country equally is far more consistent with something structural — a robots.txt rule, a noindex, a broken template, a firewall change, a tracking failure — than with a core update. That test is the backbone of the update-or-you diagnostic, and running it first prevents most wasted recovery work.
Segment 1: by page and template
Start with the Pages dimension in Search Console’s Performance report, comparing equal-length windows either side of the rollout. Rank URLs by absolute clicks lost, not percentage lost — a page that fell 90 per cent from eleven clicks is noise, and percentage sorting fills the top of the list with noise.
Then roll the URLs up into templates using a URL path filter or a regular expression: blog posts, category pages, product pages, location pages, service pages. The pattern that emerges is the finding.
| Pattern by template | What it points to |
|---|---|
| One template lost, others flat | A quality or thinness problem specific to that template |
| Programmatic or location pages lost, editorial held | Scaled content offering little beyond the obvious |
| Older posts lost, recent posts held | Content decay, or a freshness-sensitive query set |
| Everything lost roughly equally | Technical or measurement cause, not a core update |
Segment 2: by query cluster
Individual queries are too granular to reason about and the Performance report caps the rows it returns, so group queries into clusters before comparing. Regex filters in Search Console make this practical: one expression for branded queries, one per topic, one for question-form queries beginning with how, what, why or which.
Three splits do most of the work. Branded against non-branded is the first, because branded queries are largely insulated from ranking reassessment — if branded traffic fell too, suspect measurement or demand rather than the update, and see how to separate branded traffic properly. Informational against transactional is the second, and a loss confined to informational queries is the classic core update signature on a content library. Head against long tail is the third: long-tail loss with head terms intact often indicates competing pages absorbing the specific intent, while head-term loss is a broader authority question covered in topical authority.
Segment 3: by device
Switch to the Devices tab and compare mobile, desktop and tablet as separate series rather than one total. Mobile and desktop rankings are not identical and a divergence between them is diagnostic rather than incidental.
A loss on mobile only, with desktop flat, points away from content quality entirely. The usual causes are mobile rendering failures, layout shift, an interstitial, or content that is present on desktop and collapsed or omitted on mobile. A loss on desktop only, with mobile flat, is rarer and usually reflects a SERP layout difference on desktop — an AI Overview or a feature block pushing organic results down, which shows as stable positions with falling clicks rather than falling positions.
Segment 4: by country
The Countries tab matters more than most reports acknowledge, and it matters particularly for Indian sites serving both domestic and overseas audiences. Compare each significant market separately, because Google’s assessments are market-specific and a national pattern can be invisible in a global total.
There is a documented precedent for market-level movement. The February 2026 Discover core update listed showing users more locally relevant content from websites based in their country among its three stated goals, and Newzdash’s analysis of the top 1,000 US domains reported that the international share declined on a normalised basis — directionally consistent with that stated goal. If your site targets a country it is not based in, country-level segmentation is not optional.
Segment 5: by search appearance and surface
Two further splits catch losses that have nothing to do with rankings at all.
First, the search type filter. Discover and News move independently of Search, and blending them into one total hides which surface actually moved — a real risk given Discover had a core update aimed exclusively at it in February 2026. Filter to Search only for update diagnosis, then examine Discover separately.
Second, the Search Appearance dimension. Losing a rich result type, a video appearance or an FAQ appearance changes clicks without changing position at all, and it will be misread as a ranking loss by anyone reading clicks alone.
What if no segment stands out?
A loss that stays uniform through every split is a finding in itself, and it points away from the update. Check three things in order before spending another hour on segmentation.
First, indexation. Core updates re-rank pages; they do not remove them from the index. A falling indexed page count alongside a uniform loss indicates a technical cause — a noindex, a robots.txt rule, a canonical change or a broken template. Second, measurement. A property change, a consent banner change or a tag change produces a uniform apparent drop with no ranking movement behind it at all. Third, the reporting surface itself. If Search Console shows stable positions and stable impressions while your analytics shows a collapse, the problem is almost certainly in the measurement layer rather than in search.
How do you combine dimensions without fooling yourself?
Search Console lets you stack filters, and stacking is where the specific statement comes from. Filter to one template, then one query cluster, then one country, and read the comparison. The limits worth knowing are in combining Search Console dimensions and Search Console’s data limits.
- Set both comparison windows fully outside the rollout dates.
- Filter to Search only, excluding Discover and News.
- Split by template and note which templates moved.
- Inside the worst template, split branded against non-branded, then informational against transactional.
- Check devices and countries for the same filtered set.
- Write the finding as one sentence with numbers in it. If you cannot, you have not finished segmenting.
Keep the row counts honest as you narrow. Segments below a few hundred clicks per window will swing on their own, and a 60 per cent drop on nine clicks is not a finding. The point of segmentation is a statement precise enough to act on and large enough to trust, which is what turns a diagnosis into the URL shortlist that core update recovery work actually runs on.
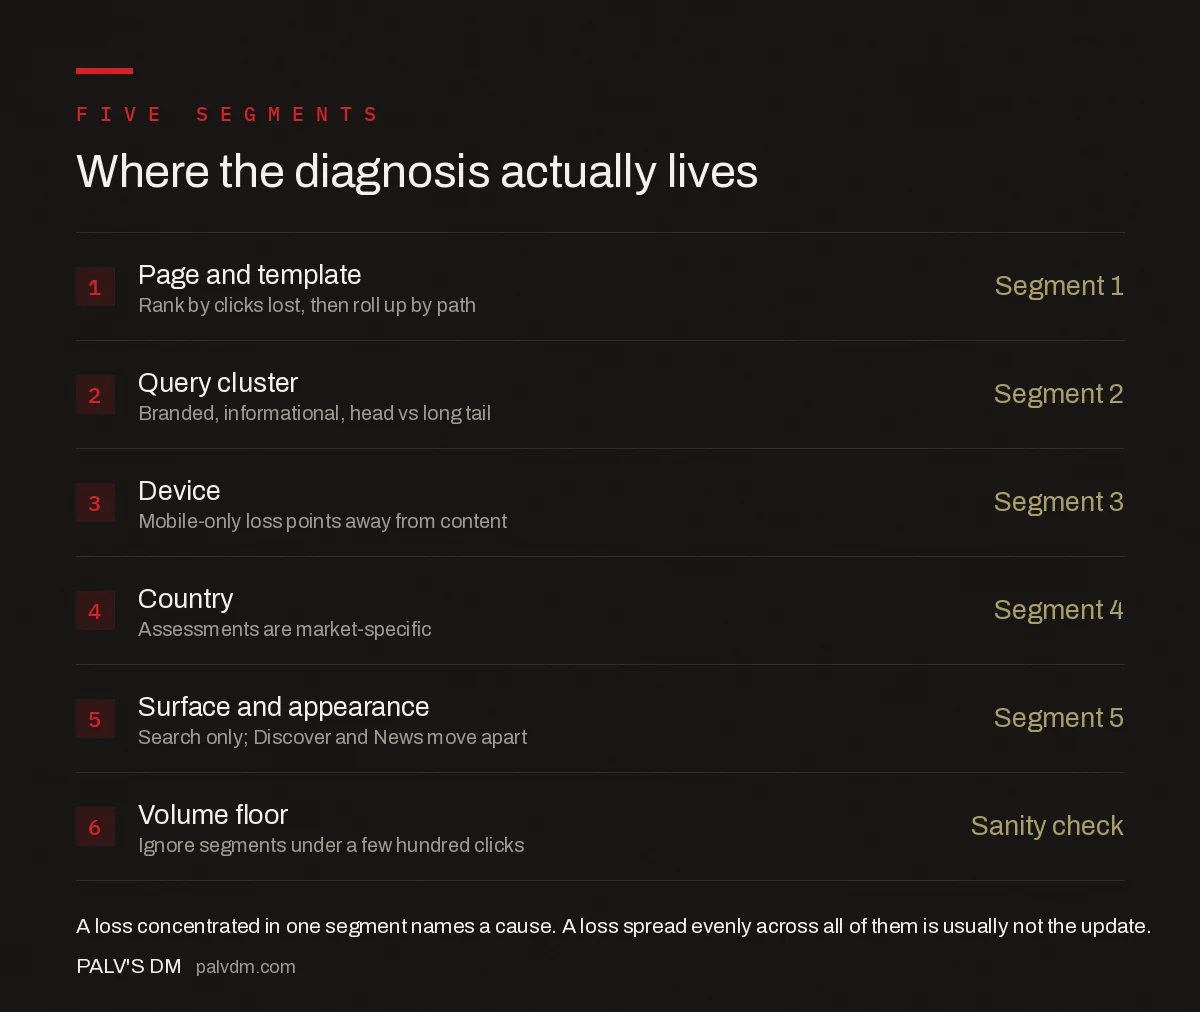
Where the diagnosis actually lives
- Page and template — Segment 1. Rank by clicks lost, then roll up by path.
- Query cluster — Segment 2. Branded, informational, head vs long tail.
- Device — Segment 3. Mobile-only loss points away from content.
- Country — Segment 4. Assessments are market-specific.
- Surface and appearance — Segment 5. Search only; Discover and News move apart.
- Volume floor — Sanity check. Ignore segments under a few hundred clicks.
Frequently asked questions
How do I analyse the impact of a Google core update on my site?
Segment the loss rather than reading a site-wide total. Compare equal-length windows either side of the rollout, then split the data by page template, query cluster, device, country and search surface. A loss concentrated in one segment identifies a cause; a loss spread evenly across every segment usually indicates a technical or measurement problem instead.
Should I sort losing pages by percentage or by clicks lost?
By absolute clicks lost. Percentage sorting fills the top of the list with low-volume pages, so a page falling from eleven clicks to one appears more damaged than a page falling from 4,000 to 2,500. Absolute loss ranks the pages where recovery work has a measurable return and keeps the shortlist to a workable size.
What does it mean if only mobile traffic dropped after an update?
A mobile-only loss with desktop flat usually points away from content quality. The common causes are mobile rendering failures, layout shift, interstitials, or content that is present on desktop but collapsed or omitted on mobile. Comparing devices as separate series rather than one total is what makes the divergence visible.
Why does country segmentation matter for core updates?
Because Google’s assessments are market-specific and a national pattern disappears inside a global total. The February 2026 Discover core update explicitly listed showing users more locally relevant content from sites based in their country among its stated goals, so any site serving a country it is not based in should compare markets separately.
Should Discover data be included when analysing a core update?
No. Filter Search Console to Search only. Discover and News move independently of Search, and Discover had a dedicated core update aimed exclusively at it between 5 and 27 February 2026. Blending surfaces produces a total that conceals which one actually moved, then sends recovery work at the wrong problem.
How small a segment is too small to trust?
As a working rule, treat segments below a few hundred clicks per comparison window as unreliable. Small segments swing on their own week to week, so a 60 per cent drop on nine clicks is noise rather than a finding. Useful segmentation produces statements that are precise enough to act on and large enough to trust.
Sources
- Search Console Performance report — Search Console Help
- Google core updates and your website — Search Central
- Google Discover documentation — Search Central
- February 2026 Google Discover Core Update Done Rolling Out — Search Engine Roundtable
Want this done on your site?
Every PalV’s DM engagement starts with a free audit of your actual website — a 12-point
crawl covering what is blocking indexation, on-page gaps against your primary keywords, speed
findings, and the three to five fixes worth making first. Delivered in two working days. No
payment details, and the findings are yours whether you hire us or not.